Ichimoku Backtest on BTC/USDT: 250 Trades Is a Fee Eater, Not a Strategy
Ichimoku looks beautiful and trades constantly. On real hourly BTC/USDT data its naive backtest returns +56.01% — and a realistic taker + slippage model turns that into -66.78%. Pandas implementation, charts, and the turnover lesson.
Ichimoku Backtest on BTC/USDT (2023, hourly, real fees)
I ran the numbers for this post and immediately thought about groceries. This strategy traded 250 times in a year. Every single one of those round trips paid fees at both ends, and every slippage basis point multiplied by 500 individual legs. The naive backtest says +56.01%. A live account would have to be the most disciplined shopper in history to keep that — I cost-check my own weekly groceries harder than this. Strategy Lab #4.
The strategy in one sentence
Ichimoku draws five lines, but the tradable core is: be long when the close is above the cloud, flat when it's inside or below. The cloud is the band between Span A and Span B, and it's projected 26 bars into the future. That projection is the reason the naive backtest looks reasonable — the cloud is always late, so you're constantly flipping in and out of the edges.
I used the standard 9/26/52 values on BTC/USDT, hourly, 2023 (8,735 bars), Binance public API. One implementation detail matters for honesty: my Span A/B are shifted 26 bars forward exactly as Ichimoku defines them. No peek at future price.
The churn problem in one table
I ran the same 250 signals through five cost models:
| Scenario | Cost/leg | Total return | MaxDD | Sharpe | Trades |
|---|---|---|---|---|---|
| naive (zero cost) | 0.00% | +56.01% | -20.72% | 1.54 | 250 |
| taker fee 0.05%/leg | 0.05% | +21.49% | -30.02% | 0.76 | 250 |
| + funding 0.01%/8h | 0.05% | +16.21% | -31.51% | 0.63 | 250 |
| + slippage 10bp/leg | 0.15% | -29.55% | -48.92% | -0.91 | 250 |
| + slippage 25bp/leg | 0.30% | -66.78% | -73.93% | -3.17 | 250 |
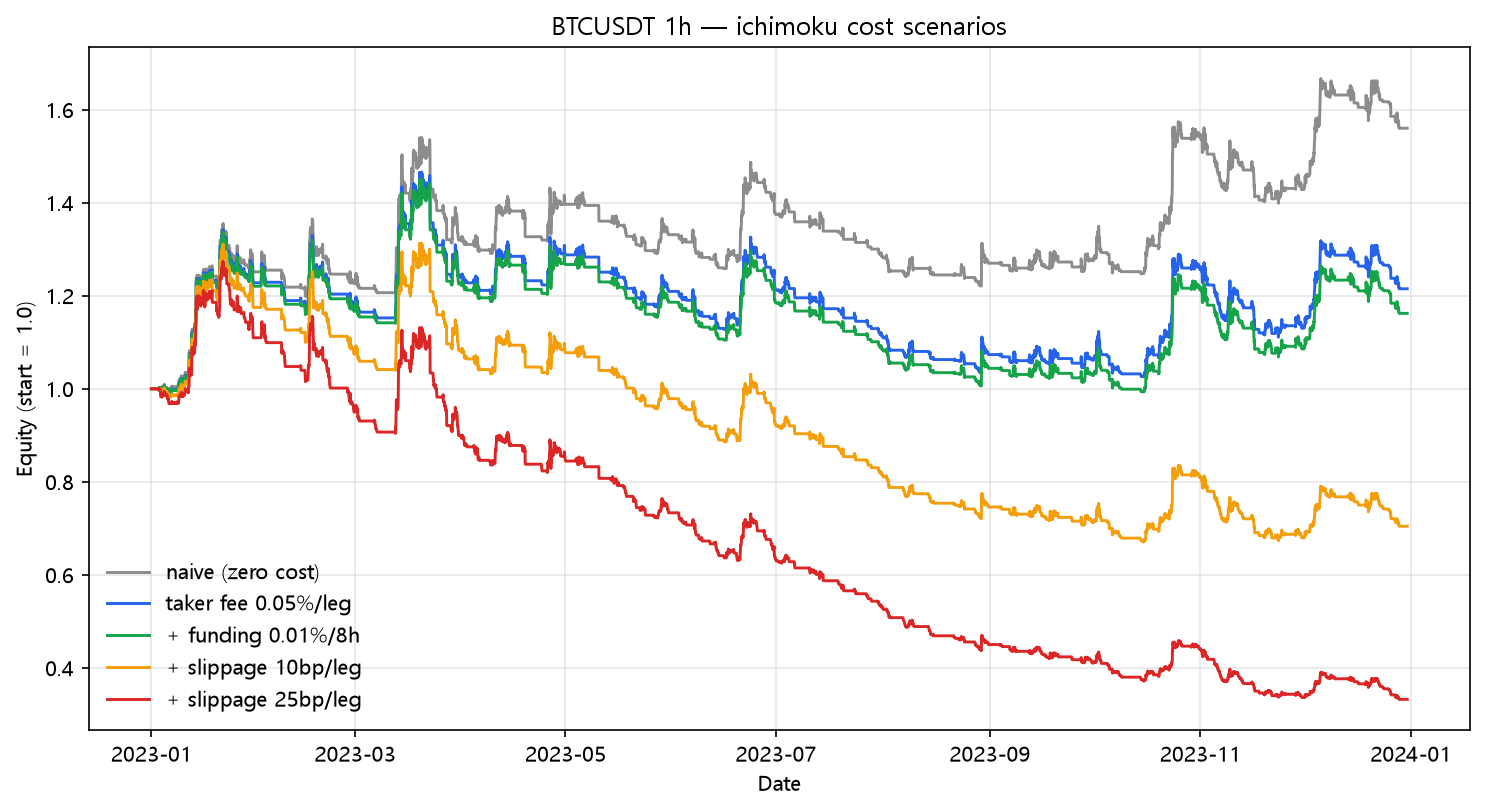
Read that table like a cautionary tale: the taker fee alone erased 35 points, funding another 5, and then slippage finished the job. +56.01% became -66.78%. This is the clearest "turnover kills" example in the whole series so far. On a live account, Ichimoku's cloud isn't a trend filter — it's a fee generator.
Results and comparison
| Strategy | Category | Total return | CAGR | MaxDD | Sharpe | Trades |
|---|---|---|---|---|---|---|
| ichimoku | trend | +16.21% | +16.26% | -31.51% | 0.63 | 250 |
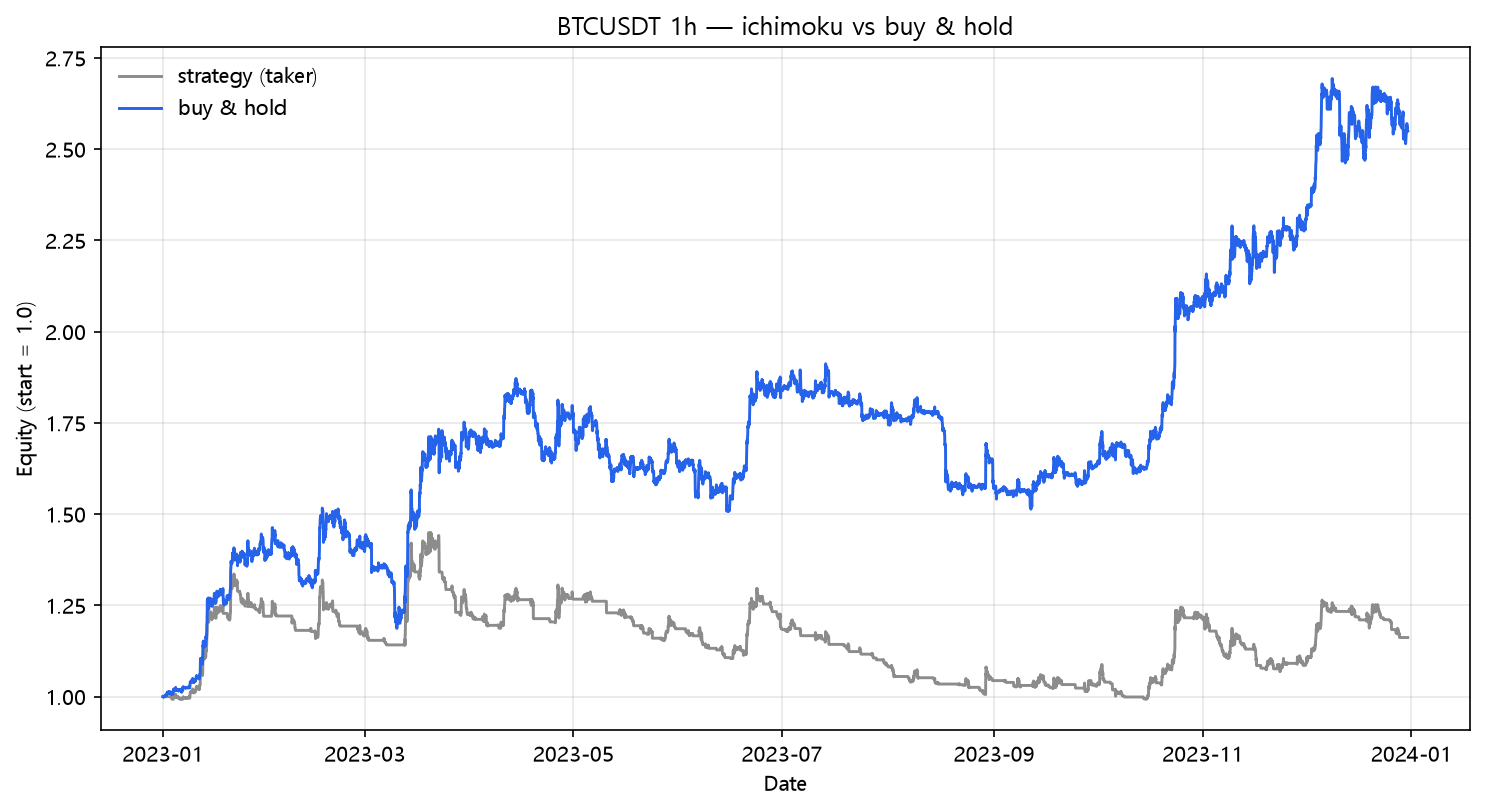
Even at zero cost this was a losing strategy against the market that year. The cloud-chasing logic whipsawed while BTC trended:
| Strategy | Total return | CAGR | MaxDD | Sharpe |
|---|---|---|---|---|
| ichimoku | +16.21% | +16.26% | -31.51% | 0.63 |
| buy & hold | +154.94% | +155.62% | -21.74% | 2.42 |
What this does NOT prove
- One symbol, one year. 2023 was strongly trending; a rangebound year could favor cloud-chasing logic more. This post is not "Ichimoku is bad" — it's "Ichimoku with the default settings and a retail fee schedule is a bad deal in a trending year."
- The turnover is the robust finding. Whatever filter you add, the lesson transfers: above ~200 round trips a year, your cost model is your strategy.
- My implementation is a minimal, honest version. Real Ichimoku traders add filters (cloud thickness, TK cross, price above Chikou) precisely to cut this churn — that's the natural next experiment.
Code
from backtest_base import fetch, backtest_signal, metrics

df = fetch("BTCUSDT", "binance", "2023-01-01", "2023-12-31", "1h")
h, l, c = df["high"], df["low"], df["close"]
conv = (h.rolling(9).max() + l.rolling(9).min()) / 2
base = (h.rolling(26).max() + l.rolling(26).min()) / 2
span_a = ((conv + base) / 2).shift(26)          # cloud, 26 bars ahead
span_b = ((h.rolling(52).max() + l.rolling(52).min()) / 2).shift(26)
signal = (c > pd.concat([span_a, span_b], axis=1).max(axis=1)).fillna(False)

res = backtest_signal(df, signal, cost_per_leg=0.0005,
                      funding_per_bar=0.0001 / 8.0)
print(metrics(res, 8760))
Reproduce it
cd blog-drafts/scripts
python backtest_base.py --strategy ichimoku --symbol BTCUSDT --interval 1h \
    --start 2023-01-01 --end 2023-12-31 --fee 0.0005 --funding 0.0000125
Data: Binance public API, hourly OHLCV, 8,735 bars. The tables above reproduce exactly from this command.
This is a backtest on historical data, not investment advice. Past performance does not predict future results.