EMA Crossover Backtested on BTC/USDT: 8,735 Hourly Candles and Real Fees
The classic EMA crossover looks great on paper. Running it on real hourly BTC/USDT data with taker fees, funding and slippage turns +110.12% into +51.17%. Full pandas code, charts and a buy-and-hold comparison inside.
EMA Crossover Backtested on BTC/USDT (2023, hourly, real fees)
I keep a list of strategies that beat me. It's a long list. The EMA crossover is near the top, because it's the first one most people draw, and I was convinced for years that it couldn't work on anything but a trending stock chart. This post is me running it properly — real data, real costs — and writing down what I find. Strategy Lab #1.
The strategy everyone draws first
Two exponential moving averages. When the short one crosses above the long one, hold long. When it crosses back below, go to cash. That's it. No stops, no filters, long-only.
I used the same parameters people pull out of the air: EMA(24) and EMA(120) on 1-hour bars. Slow enough to trade actual trends, fast enough to be wrong a manageable number of times.
What I ran
- Symbol: BTC/USDT perpetual, hourly candles from Binance's public API (no key needed)
- Period: 2023-01-01 00:00 UTC to 2023-12-30 23:00 UTC — 8,735 bars
- Signals computed at candle close, position taken from the next candle (no lookahead)
- Costs: taker fee 0.05% per leg, funding 0.01%/8h while holding, then slippage scenarios
Code
The full shared module is blog-drafts/scripts/backtest_base.py. The strategy itself is nine lines:
from backtest_base import fetch, backtest_signal, metrics

df = fetch("BTCUSDT", "binance", "2023-01-01", "2023-12-31", "1h")
close = df["close"]
fast = close.ewm(span=24, adjust=False).mean()
slow = close.ewm(span=120, adjust=False).mean()
signal = (fast > slow).fillna(False)   # position taken next bar

res = backtest_signal(df, signal, cost_per_leg=0.0005,
                      funding_per_bar=0.0001 / 8.0)
print(metrics(res, 8760))
Results
With taker fees and funding applied:
| Strategy | Category | Total return | CAGR | MaxDD | Sharpe | Trades |
|---|---|---|---|---|---|---|
| ema_cross | trend | +89.38% | +89.73% | -22.60% | 2.06 | 45 |
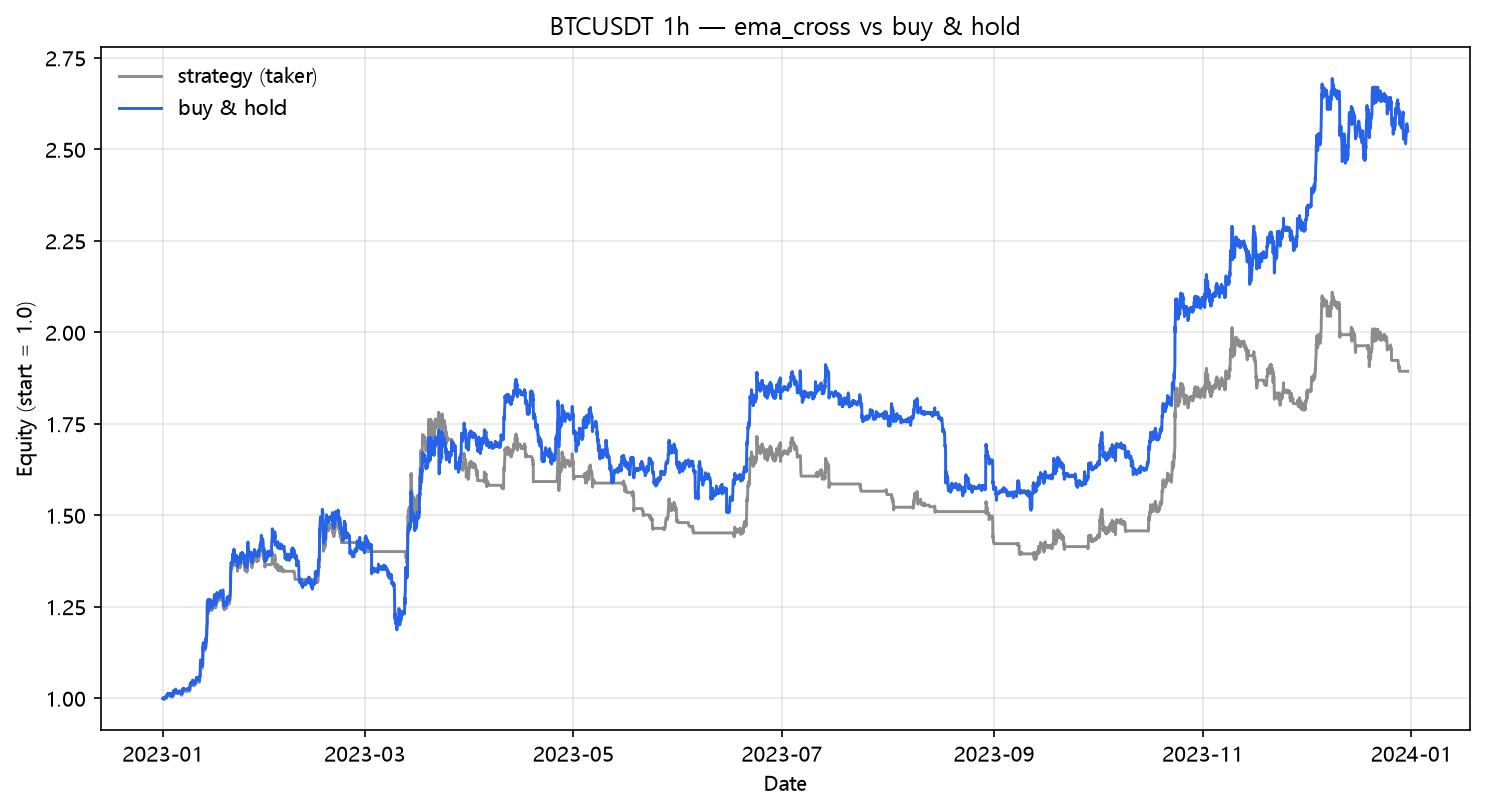
45 round trips over the year. That's not "set and forget" — it's a few trades a week, each one paying fees at both ends.
What costs do to it
Here's the part I originally missed. I ran the same 45 signals five times, changing only the cost model:
| Scenario | Cost/leg | Total return | MaxDD | Sharpe | Trades |
|---|---|---|---|---|---|
| naive (zero cost) | 0.00% | +110.12% | -18.88% | 2.37 | 45 |
| taker fee 0.05%/leg | 0.05% | +100.88% | -21.05% | 2.23 | 45 |
| + funding 0.01%/8h | 0.05% | +89.38% | -22.60% | 2.06 | 45 |
| + slippage 10bp/leg | 0.15% | +73.07% | -26.67% | 1.79 | 45 |
| + slippage 25bp/leg | 0.30% | +51.17% | -32.39% | 1.39 | 45 |
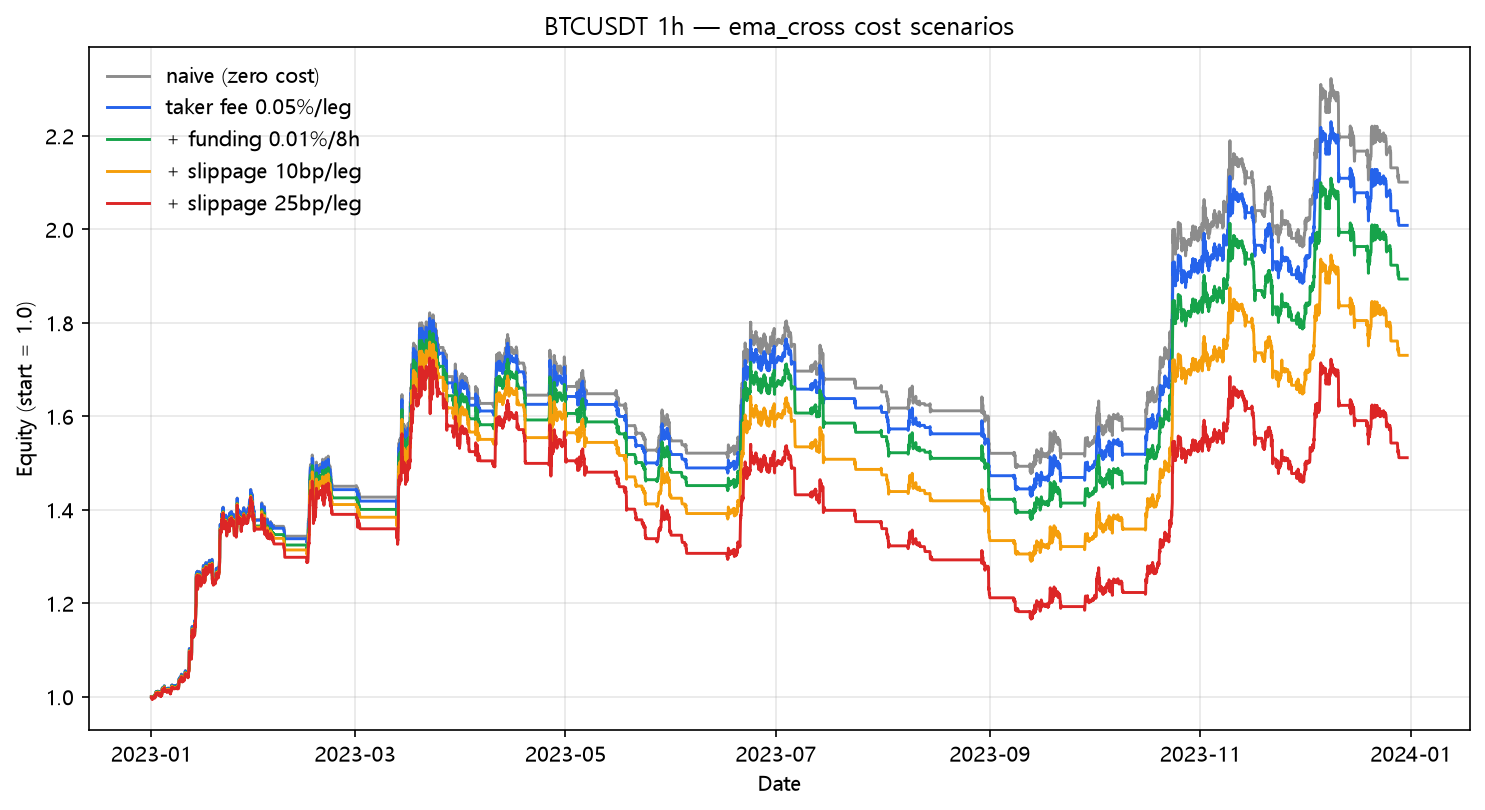
The gray line (+110%) is not a lie — it's the answer to a different question. Add the costs a live account actually pays and the same signals earn +51.17%, with the max drawdown nearly doubling. I wrote about this exact trap in Backtest Fees & Slippage, but it deserves repeating in every strategy post: cost assumptions are part of the strategy.
Buy and hold comparison
The honest baseline:
| Strategy | Total return | CAGR | MaxDD | Sharpe |
|---|---|---|---|---|
| ema_cross | +89.38% | +89.73% | -22.60% | 2.06 |
| buy & hold | +154.94% | +155.62% | -21.74% | 2.42 |
2023 was a strong up year for BTC. Buy and hold won on return and drawdown. The crossover's only genuine edge here is a slightly cleaner ride in the first half — the strategy was flat or short periods that hold ate. On a flat or bear year the comparison would look very different, which is exactly why one year of data proves nothing by itself.
What this does NOT prove
- 45 trades is a tiny sample. This is one year on one symbol. Nothing here is statistical significance.
- These parameters are arbitrary. EMA(24)/120 beat EMA(5)/50 on this data. I did not tune them to make it look good — and neither should you. Parameter sensitivity gets its own post in this series.
- No stops. This is a pure signal follower; that -22.60% maxDD is the strategy wearing its honest face.
Reproduce it
cd blog-drafts/scripts
python backtest_base.py --strategy ema_cross --symbol BTCUSDT --interval 1h \
    --start 2023-01-01 --end 2023-12-31 --fee 0.0005 --funding 0.0000125
All charts are generated by gen_post_assets.py. Data: Binance public API, hourly OHLCV. Reproduction command, code and exact parameter values are all above — run it and the table reproduces exactly.
This is a backtest on historical data, not investment advice. Past performance does not predict future results.