Keltner Channel Breakout Backtest on BTC/USDT: Buying Strength for a Fee
The Keltner channel breakout — buy when price crosses above an ATR-based channel. On real hourly BTC/USDT it returns +39.22% at zero cost and -30.61% with realistic fees. How it compares to Bollinger, in pandas with charts.
Keltner Channel Breakout Backtest on BTC/USDT (2023, hourly, real fees)
My cat has a habit of sitting on whatever chart I'm about to make a decision on. I've learned to read it as an omen: the markets, like her, do what they want. So when someone tells me a channel is going to "contain" or "catch" a breakout, I think of her. Channels are just lines drawn in sand — and the Keltner channel, unlike her, is honest about it. Strategy Lab #13.
Keltner vs Bollinger — two channels, two philosophies
Both are volatility envelopes drawn around a moving average, and beginners confuse them constantly:
- Bollinger Bands: center = SMA(20), width = 2 × standard deviation of close. Std-dev widens with big moves in either direction — it reacts to price spikes.
- Keltner Channel: center = EMA(20), width = 2 × ATR. ATR is built from true range, so the channel tracks actual volatility range rather than price dispersion — smoother, less reactive to single candles.
Philosophy matters more than math. In this series I used Bollinger as mean reversion (buy the lower band, exit mid) on AAPL. Here I'm using Keltner as a breakout — the opposite bet:
- Buy when the close crosses above the upper channel (strength, not weakness).
- Sell when the close crosses back below the middle EMA.
112 trades on hourly BTC/USDT in 2023. Moderate turnover — enough to be a problem, not so much that it's obviously suicidal.
Results
| Strategy | Category | Total return | CAGR | MaxDD | Sharpe | Trades |
|---|---|---|---|---|---|---|
| keltner | breakout | +21.60% | +21.67% | -28.36% | 0.89 | 112 |
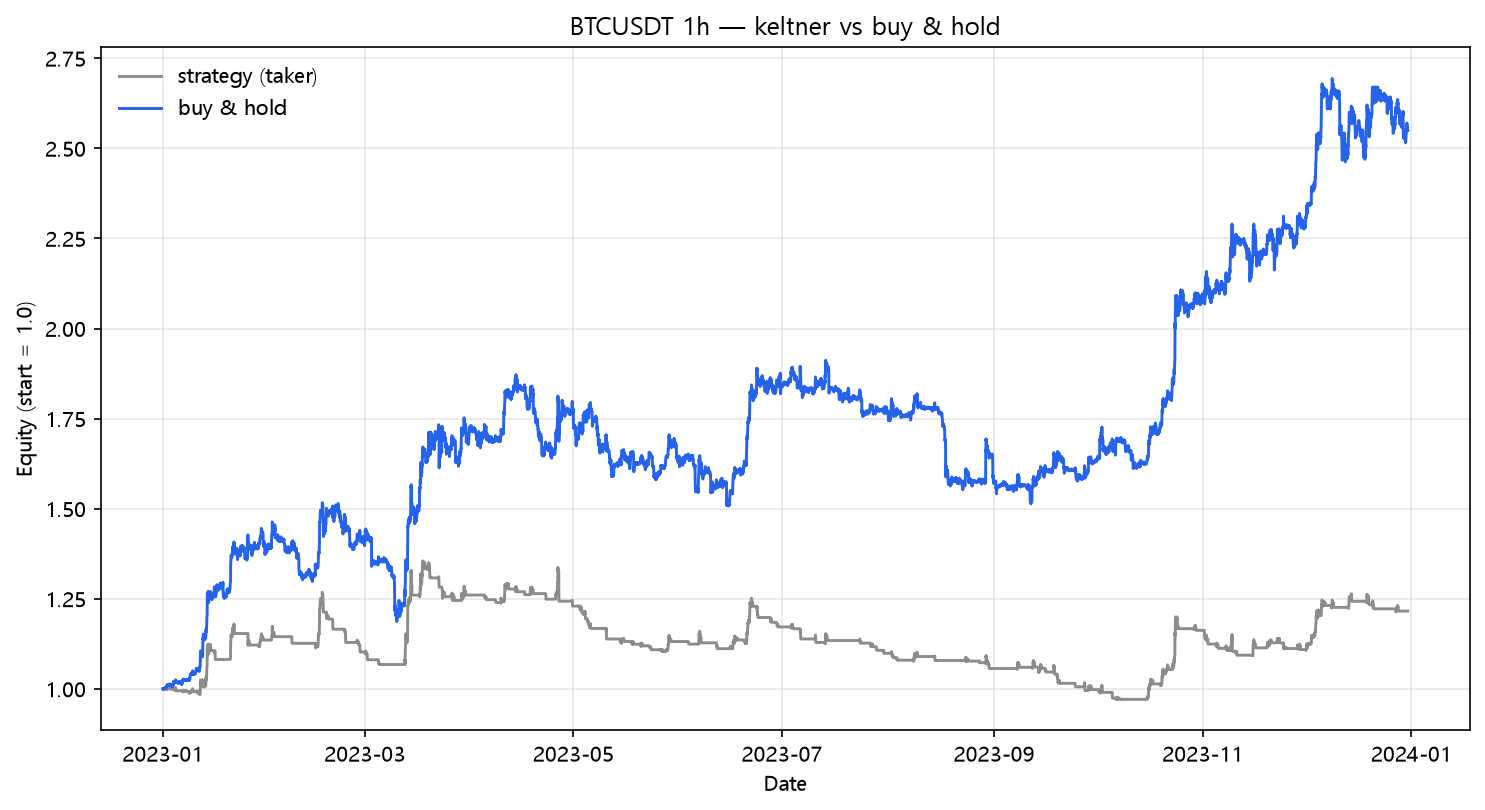
A breakout strategy that only keeps positions above the middle EMA means it's always buying strength and always bailing at the first sign of weakness. In 2023's choppy first half, that translated into 112 round trips where a "breakout" of an hourly channel was often just noise.
The fee bill
| Scenario | Cost/leg | Total return | MaxDD | Sharpe | Trades |
|---|---|---|---|---|---|
| naive (zero cost) | 0.00% | +39.22% | -22.88% | 1.42 | 112 |
| taker fee 0.05%/leg | 0.05% | +24.46% | -27.58% | 0.98 | 112 |
| + funding 0.01%/8h | 0.05% | +21.60% | -28.36% | 0.89 | 112 |
| + slippage 10bp/leg | 0.15% | -2.82% | -37.29% | 0.02 | 112 |
| + slippage 25bp/leg | 0.30% | -30.61% | -48.69% | -1.27 | 112 |
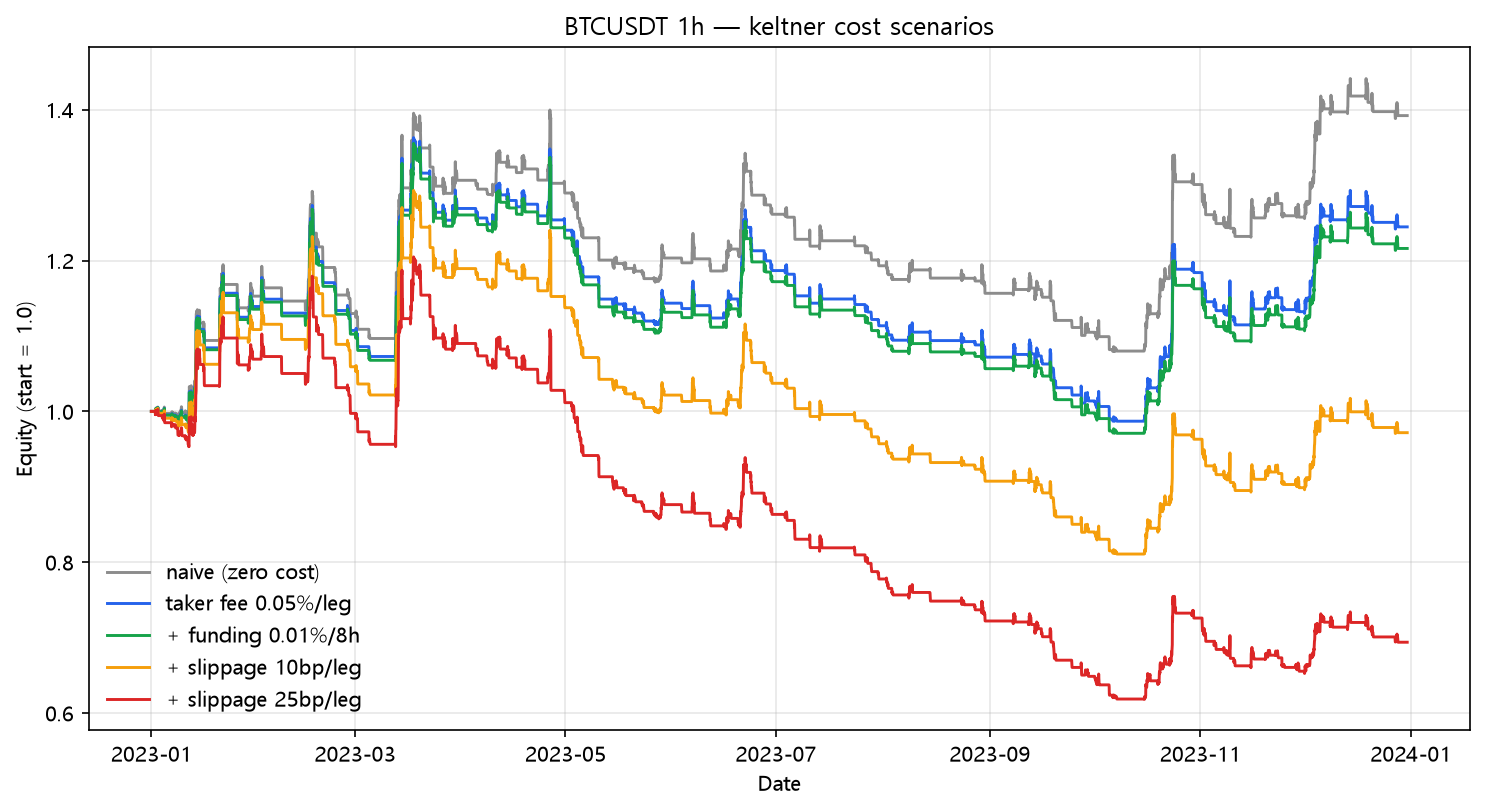
+39.22% → -30.61%. The breakout is real at zero cost — buying strength did beat buying dips on this data. But breakout logic lives and dies on being right early, and on hourly candles "early" means "slightly before the false breakout," which you pay for every single time. 224 legs at taker-plus-slippage turns a winner into a loser.
Buy and hold comparison
| Strategy | Total return | CAGR | MaxDD | Sharpe |
|---|---|---|---|---|
| keltner | +21.60% | +21.67% | -28.36% | 0.89 |
| buy & hold | +154.94% | +155.62% | -21.74% | 2.42 |
What this does NOT prove
- One symbol, one year, defaults (20/2). The channel's whole personality lives in the ATR multiplier — 2× is gentle, 3× is a different strategy entirely.
- The contrast with Bollinger on AAPL is the valuable part: two channels, two philosophies, two markets. The cross-check to run next is the same Keltner breakout on daily stocks, where clean breakouts are rarer but real.
- The robust finding: on hourly crypto, "channel breakout" needs a filter (volume, higher timeframe, wider ATR) to stop being a noise detector. Buying every poke above an hourly band is just paying for the privilege of watching channels break.
Code
from backtest_base import fetch, backtest_signal, metrics
from strategy import atr

df = fetch("BTCUSDT", "binance", "2023-01-01", "2023-12-31", "1h")
close = df["close"]
mid = close.ewm(span=20, adjust=False).mean()
upper = mid + atr(df, 20) * 2

enter = (close > upper).to_numpy()
exit_ = (close < mid).to_numpy()
signal = stateful_position(enter, exit_)     # buy breakout, bail at mid

res = backtest_signal(df, signal, cost_per_leg=0.0005,
                      funding_per_bar=0.0001 / 8.0)
print(metrics(res, 8760))
Reproduce it
cd blog-drafts/scripts
python backtest_base.py --strategy keltner --symbol BTCUSDT --interval 1h \
    --start 2023-01-01 --end 2023-12-31 --fee 0.0005 --funding 0.0000125
Data: Binance public API, hourly OHLCV, 8,735 bars. The tables above reproduce exactly from this command.
This is a backtest on historical data, not investment advice. Past performance does not predict future results.