SMA vs EMA Crossover on BTC/USDT: One Letter, 25% Difference
The same crossover with a simple moving average instead of an exponential one. On real hourly BTC/USDT data the SMA version trades more, draws down more and earns +68.08% vs +89.38% — and slippage cuts it to +28.89%. Python code and charts.
SMA vs EMA Crossover on BTC/USDT (2023, hourly, real fees)
I tried explaining the difference between a simple and an exponential moving average to my wife once. She nodded along, then asked if I was building a weather app. The truth is, most of the time the difference really is that small — until you put both of them on the same trading strategy and let them fight it out over 8,735 candles. Strategy Lab #2.
The setup — identical except one word
This is the exact same experiment as the EMA crossover post, with a single change: the moving averages are simple instead of exponential.
- SMA weights every bar in the window equally. A price spike from six months ago still pushes today's average around.
- EMA weights recent bars more. It reacts faster, and the whole average is continuous — no bar ever "falls off" abruptly.
Same parameters: SMA(24) / SMA(120), BTC/USDT, 1-hour bars, 2023 full year, Binance public API.
Code
The shared module computes both with one flag — but for the series I implemented each explicitly. The SMA version:
from backtest_base import fetch, backtest_signal, metrics

df = fetch("BTCUSDT", "binance", "2023-01-01", "2023-12-31", "1h")
close = df["close"]
fast = close.rolling(24).mean()
slow = close.rolling(120).mean()
signal = (fast > slow).fillna(False)   # position taken next bar

res = backtest_signal(df, signal, cost_per_leg=0.0005,
                      funding_per_bar=0.0001 / 8.0)
print(metrics(res, 8760))
Results
| Strategy | Category | Total return | CAGR | MaxDD | Sharpe | Trades |
|---|---|---|---|---|---|---|
| sma_cross | trend | +68.08% | +68.33% | -29.62% | 1.71 | 53 |
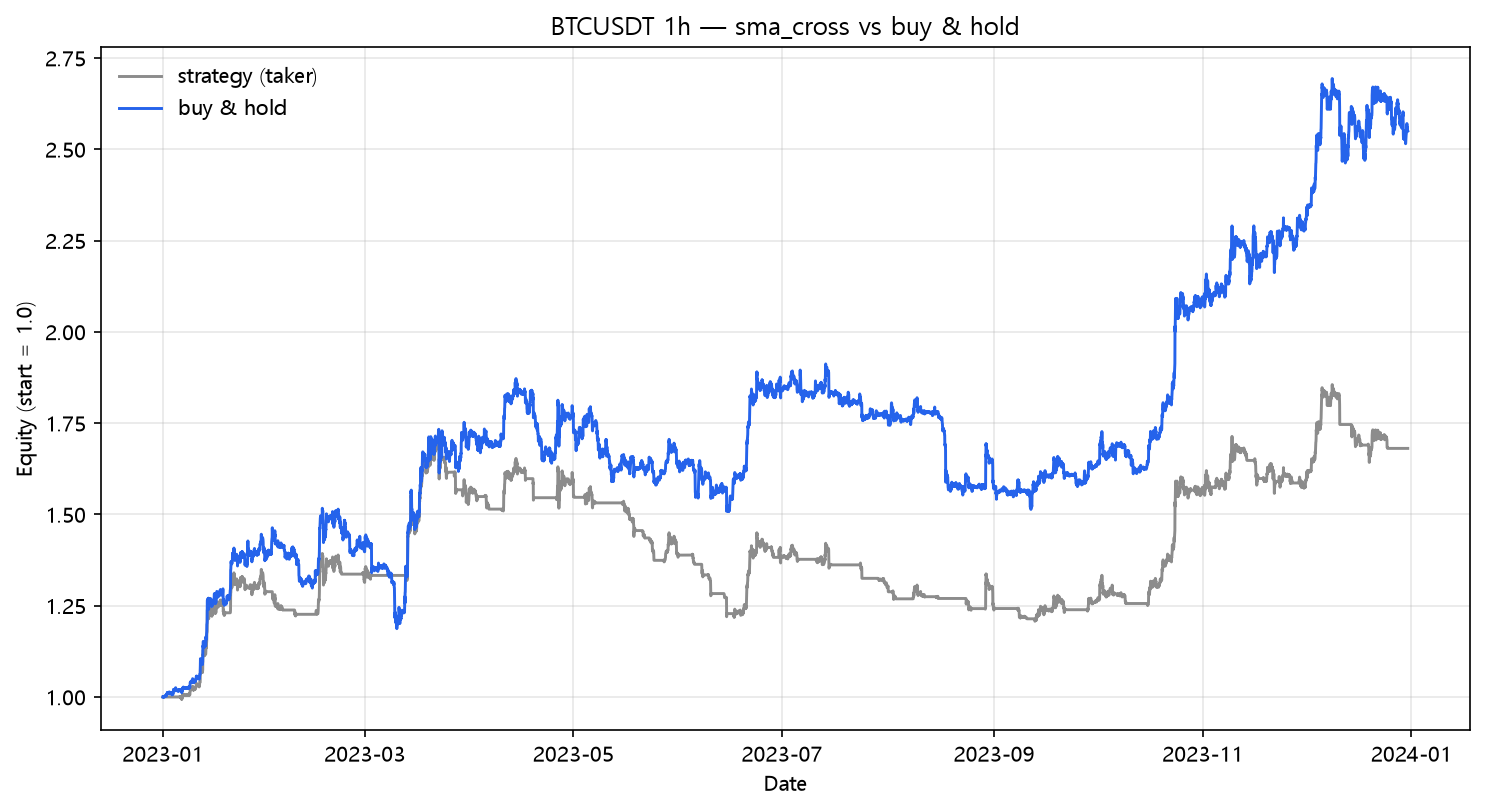
Against the EMA version: +68.08% vs +89.38%, max drawdown -29.62% vs -22.60%, and 53 trades vs 45. The SMA flipped more often (each flip paid fees), it caught less of each trend, and it sat through deeper pullbacks.
That's the mechanical reason, and it's a good lesson on its own: the smoothness of your average is a position-sizing decision in disguise. A laggier signal means fewer, later, larger moves — and more of your capital riding through drawdowns.
Costs hit it harder than the EMA version
| Scenario | Cost/leg | Total return | MaxDD | Sharpe | Trades |
|---|---|---|---|---|---|
| naive (zero cost) | 0.00% | +87.68% | -26.90% | 2.04 | 53 |
| taker fee 0.05%/leg | 0.05% | +77.99% | -28.28% | 1.88 | 53 |
| + funding 0.01%/8h | 0.05% | +68.08% | -29.62% | 1.71 | 53 |
| + slippage 10bp/leg | 0.15% | +51.16% | -34.12% | 1.39 | 53 |
| + slippage 25bp/leg | 0.30% | +28.89% | -40.35% | 0.92 | 53 |
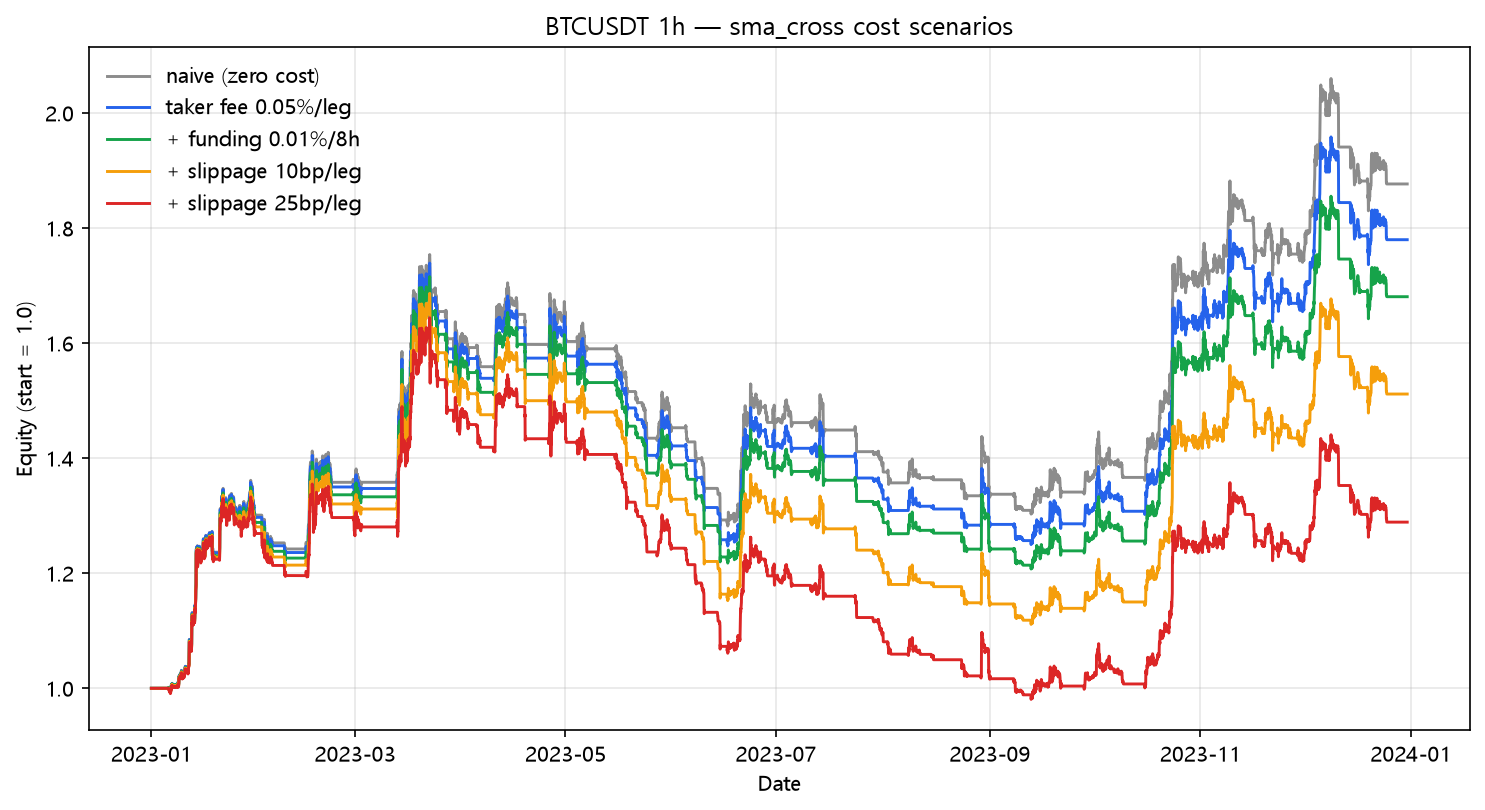
+87.68% with no costs becomes +28.89% with a realistic taker + slippage model. Notice the gap between the two crossover families grows as costs rise — the SMA's extra eight trades become genuinely expensive. When people debate SMA vs EMA, the real debate is often hidden in their fee schedule.
Buy and hold comparison
| Strategy | Total return | CAGR | MaxDD | Sharpe |
|---|---|---|---|---|
| sma_cross | +68.08% | +68.33% | -29.62% | 1.71 |
| ema_cross | +89.38% | +89.73% | -22.60% | 2.06 |
| buy & hold | +154.94% | +155.62% | -21.74% | 2.42 |
2023 was a strong up year, so both crossovers trail buy and hold — the EMA version by less. This doesn't mean EMA is "better"; it means on this symbol, this year, with these costs, the EMA reacted early enough to matter. The honest takeaway for someone building their own system: test the variant you didn't assume was worse. I assumed SMA was more robust because it ignores noise. The data disagreed.
What this does NOT prove
- One year, one symbol, 53 trades. Small sample.
- These were the parameters I picked, not tuned. I did not optimize the fast/slow pair for this data.
- No stops — the -29.62% maxDD is the unvarnished strategy.
- The SMA's behavior (later entries, deeper drawdowns) is the robust finding; the specific returns are not.
Reproduce it
cd blog-drafts/scripts
python backtest_base.py --strategy sma_cross --symbol BTCUSDT --interval 1h \
    --start 2023-01-01 --end 2023-12-31 --fee 0.0005 --funding 0.0000125
Data: Binance public API, hourly OHLCV, 8,735 bars. Run it and the tables above reproduce exactly.
This is a backtest on historical data, not investment advice. Past performance does not predict future results.