RSI(2) Mean Reversion Backtest on BTC/USDT: Catching Falling Knives for a Fee
The classic RSI(2) buy-the-dip strategy, backtested on real hourly BTC/USDT. Zero-cost result +56.32%, but 269 round trips and realistic taker plus slippage turn it into -70.39%. Pandas implementation, charts, and the knife problem.
RSI(2) Mean Reversion Backtest on BTC/USDT (2023, hourly, real fees)
Every dip buyer thinks they're brave right up until the knife turns out to be a falling anvil. I know, because I've caught several of each. RSI(2) mean reversion is the algorithmic version of that instinct — "buy when everyone is panicking" — codified into two numbers. It sounded responsible, even contrarian. Then I met its fee schedule. Strategy Lab #8.
What RSI(2) mean reversion is
RSI measures momentum on a 0–100 scale; at a period of 2 it's jumpy and extreme. The strategy is brutally simple:
- Buy when RSI(2) drops below 10 — the market is oversold, short-term panic.
- Sell when RSI(2) climbs above 90 — the bounce has run.
The whole bet is that short-term panic is wrong, and price snaps back. On stocks with daily bars this is a real, well-documented edge. On crypto at hourly frequency it's a different animal — one where "oversold" can stay oversold for hours while the market keeps sliding, and every failed bounce is another round-trip of fees.
Results
| Strategy | Category | Total return | CAGR | MaxDD | Sharpe | Trades |
|---|---|---|---|---|---|---|
| rsi_meanrev | meanrev | +13.64% | +13.68% | -22.68% | 0.60 | 269 |
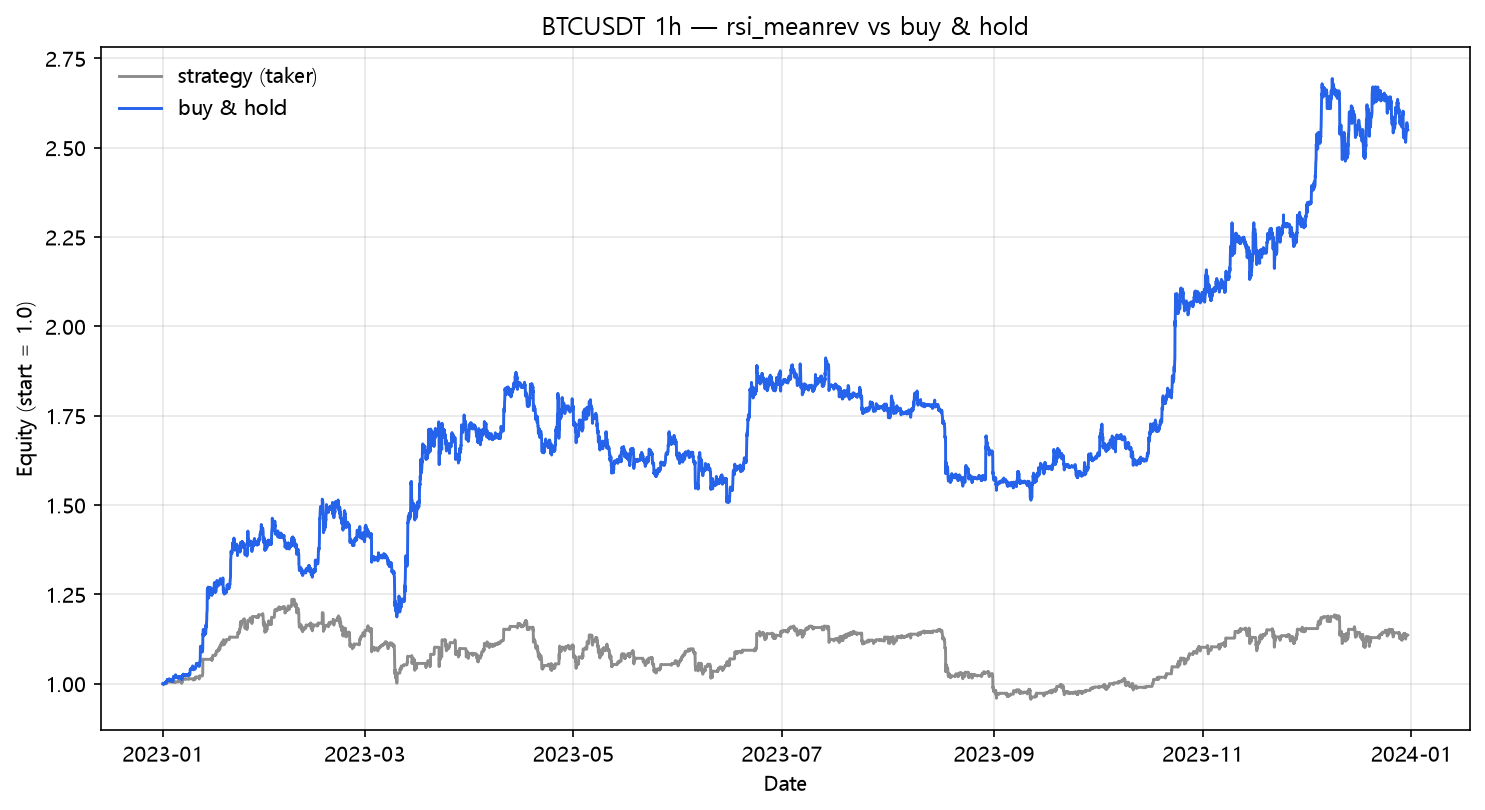
269 trades for a +13.64% net return. Notice the naive max drawdown in the table below (-16.62%) — the best of anything in the series so far. That's the honest strength of mean reversion: it sits in cash during the crash, because "buy the panic" is already in. But that strength gets eaten alive by the turnaround count.
The fee bill
| Scenario | Cost/leg | Total return | MaxDD | Sharpe | Trades |
|---|---|---|---|---|---|
| naive (zero cost) | 0.00% | +56.32% | -16.62% | 1.76 | 269 |
| taker fee 0.05%/leg | 0.05% | +19.50% | -20.11% | 0.79 | 269 |
| + funding 0.01%/8h | 0.05% | +13.64% | -22.68% | 0.60 | 269 |
| + slippage 10bp/leg | 0.15% | -33.61% | -45.11% | -1.34 | 269 |
| + slippage 25bp/leg | 0.30% | -70.39% | -72.79% | -4.18 | 269 |
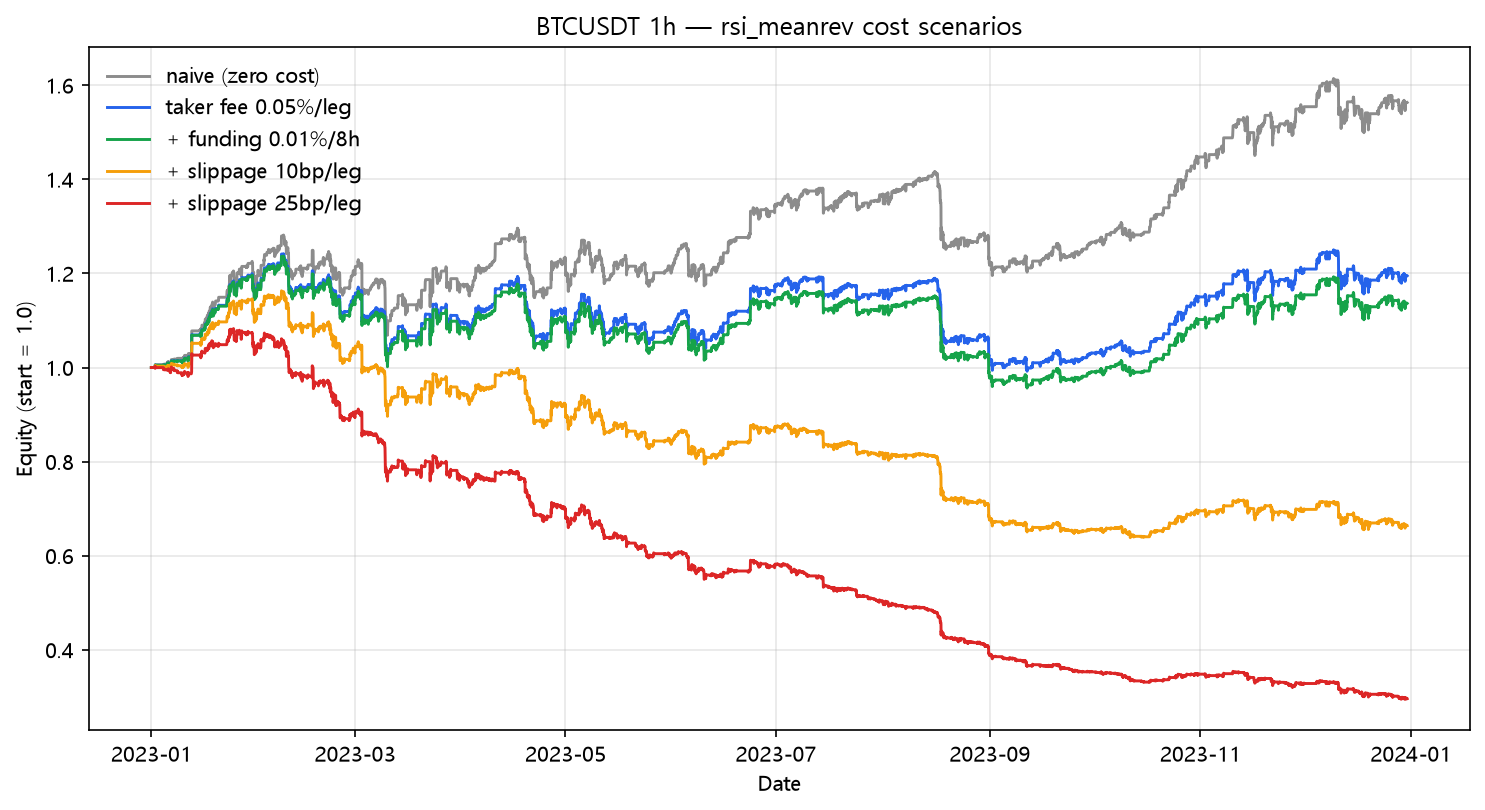
+56.32% → -70.39%. Same 269 signals, five different cost stories. Mean reversion is uniquely fragile to slippage because it buys into the exact moments of worst liquidity — you're buying when everyone else is selling, so your fill is systematically on the wrong side of the spread. That's the falling-knife tax you can't see in a no-cost backtest.
Buy and hold comparison
| Strategy | Total return | CAGR | MaxDD | Sharpe |
|---|---|---|---|---|
| rsi_meanrev | +13.64% | +13.68% | -22.68% | 0.60 |
| buy & hold | +154.94% | +155.62% | -21.74% | 2.42 |
What this does NOT prove
- One symbol, one year, hourly. On daily bars, or on a mean-reverting asset like a rangebound index, this family of strategies behaves completely differently — the timeframe is the variable being tested, not mean reversion itself.
- 10/90 thresholds are arbitrary. RSI(2) results are notoriously sensitive to them, and tuning to 2023's data is the definition of overfitting.
- The robust finding: a strategy whose edge lives in quick bounces must survive the cost of catching them. Slippage on panic sells is not a detail — it's the strategy's operating cost.
Code
from backtest_base import fetch, backtest_signal, metrics
from strategy import rsi

df = fetch("BTCUSDT", "binance", "2023-01-01", "2023-12-31", "1h")
r = rsi(df["close"], period=2)
enter = (r < 10).to_numpy()
exit_ = (r > 90).to_numpy()
signal = stateful_position(enter, exit_)     # buy panic, sell the bounce

res = backtest_signal(df, signal, cost_per_leg=0.0005,
                      funding_per_bar=0.0001 / 8.0)
print(metrics(res, 8760))
Reproduce it
cd blog-drafts/scripts
python backtest_base.py --strategy rsi_meanrev --symbol BTCUSDT --interval 1h \
    --start 2023-01-01 --end 2023-12-31 --fee 0.0005 --funding 0.0000125
Data: Binance public API, hourly OHLCV, 8,735 bars. The tables above reproduce exactly from this command.
This is a backtest on historical data, not investment advice. Past performance does not predict future results.