Stochastic Crossover Backtest on BTC/USDT: 1,798 Trades to Lose 100%
The Stochastic %K/%D crossover backtests at +79.05% on real hourly BTC/USDT — until you add costs. Taker fees make it -70.36%, and realistic slippage wipes the account to -99.96%. The ultimate turnover warning. Pandas code and charts.
Stochastic Crossover Backtest on BTC/USDT (2023, hourly, real fees)
In Lisbon I once shared a coworking desk with a guy who traded the Stochastic oscillator by eye and swore it was free money. He was kind, generous, and genuinely confused about why his account kept shrinking. This post is my apology to him, written a decade late. The Stochastic crossover is the most dangerous backtest in this whole series, because it looks great until the fee schedule arrives. Strategy Lab #10.
The setup
- %K = where the close sits within the last 14 bars, on a 0–100 scale.
- %D = a 3-bar average of %K.
- Rule: long while %K is above %D. That's it. One of the most common settings on TradingView.
Here's the tell: this rule flipped position 1,798 times in 8,735 bars — an average of one round trip every 5 hours. On hourly BTC the two lines cross constantly, and my implementation honestly trades every single cross. No filters, no zones, no "only trade in oversold." Just the raw crossover.
The zero-cost illusion
| Strategy | Category | Total return | CAGR | MaxDD | Sharpe | Trades |
|---|---|---|---|---|---|---|
| stoch | meanrev | -71.31% | -71.41% | -76.41% | -3.97 | 1,798 |
| Scenario | Cost/leg | Total return | MaxDD | Sharpe | Trades |
|---|---|---|---|---|---|
| naive (zero cost) | 0.00% | +79.05% | -23.85% | 2.08 | 1,798 |
| taker fee 0.05%/leg | 0.05% | -70.36% | -75.72% | -3.87 | 1,798 |
| + funding 0.01%/8h | 0.05% | -71.31% | -76.41% | -3.97 | 1,798 |
| + slippage 10bp/leg | 0.15% | -99.22% | -99.22% | -15.53 | 1,798 |
| + slippage 25bp/leg | 0.30% | -99.96% | -100.00% | -30.82 | 1,798 |
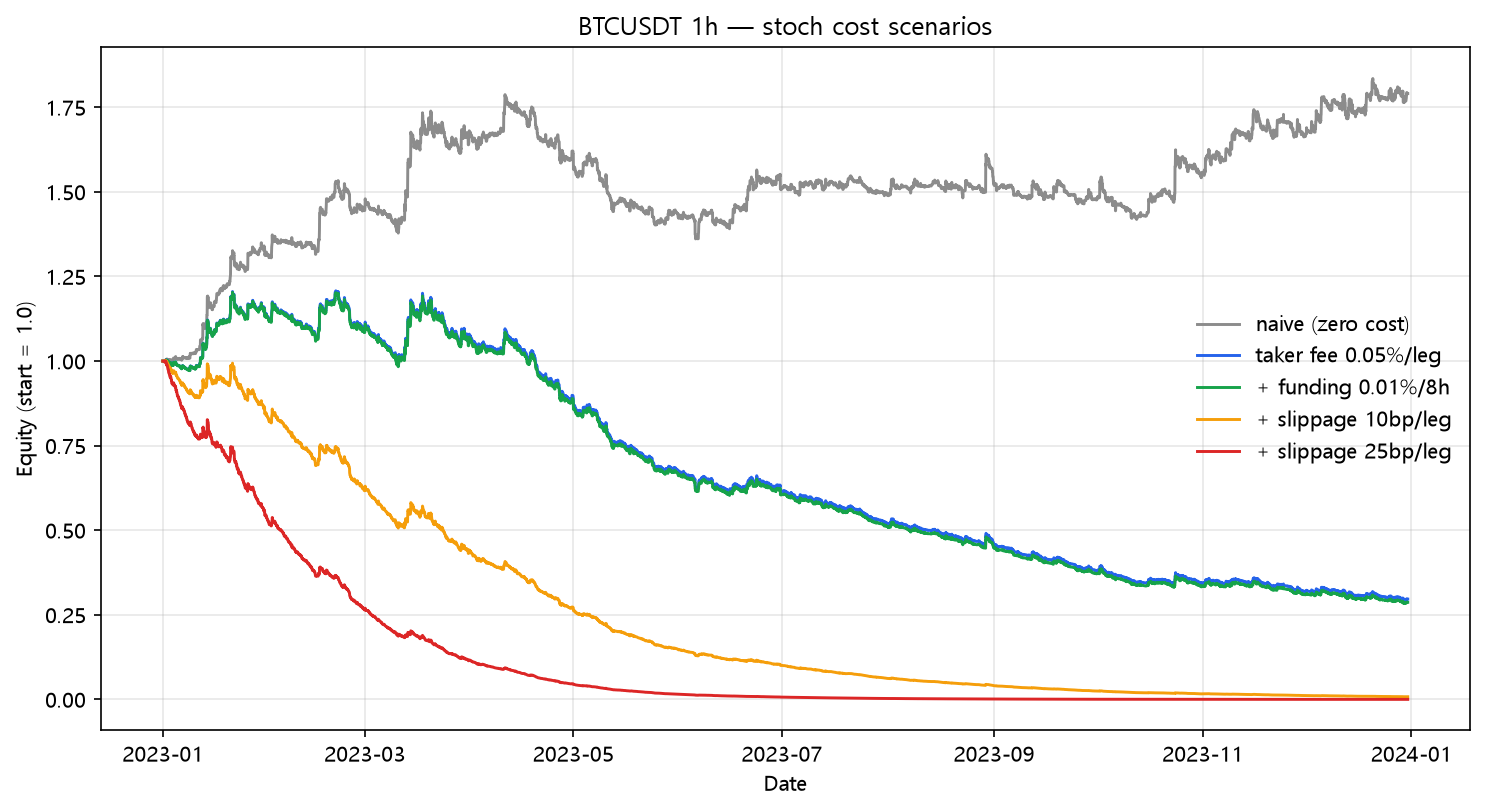
+79.05% → -99.96%. Let that sink in. This strategy doesn't underperform under realistic costs — it ceases to exist. The zero-cost version has a tidy Sharpe of 2.08 and a modest -23.85% drawdown. It is a perfect advertisement for how badly a backtest can lie. The naive result is the fee schedule being left out; the taker-fee result is the first honest number.
Why the crossover is a fee payment plan
Every %K/%D cross on an hourly chart is a short-term noise event. The indicator measures where the close sits in a rolling range — in a choppy market that's a coin flip, and a coin flip traded 3,596 times a year is a fee machine. The math is brutal: 3,596 legs × 0.05% = 180% of account in fees at taker rates before a single basis point of slippage. No signal edge can survive that.
Buy and hold comparison
| Strategy | Total return | CAGR | MaxDD | Sharpe |
|---|---|---|---|---|
| stoch | -71.31% | -71.41% | -76.41% | -3.97 |
| buy & hold | +154.94% | +155.62% | -21.74% | 2.42 |
Code
from backtest_base import fetch, backtest_signal, metrics

df = fetch("BTCUSDT", "binance", "2023-01-01", "2023-12-31", "1h")
low_k = df["low"].rolling(14).min()
high_k = df["high"].rolling(14).max()
kk = 100 * (df["close"] - low_k) / (high_k - low_k).replace(0, np.nan)
kk = kk.fillna(50)
signal = (kk > kk.rolling(3).mean()).fillna(False)   # %K above %D

res = backtest_signal(df, signal, cost_per_leg=0.0005,
                      funding_per_bar=0.0001 / 8.0)
print(metrics(res, 8760))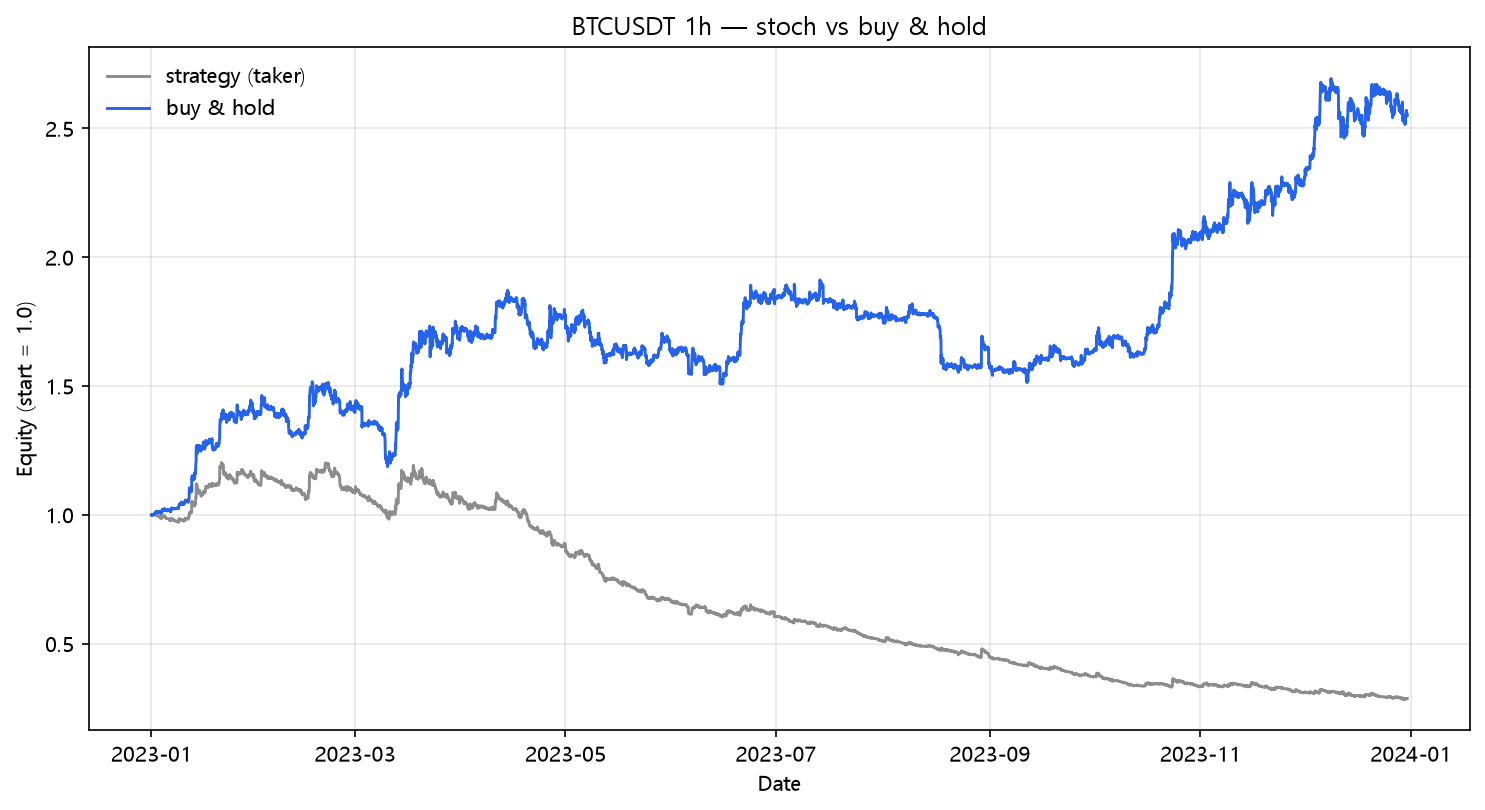
What this does NOT prove
- I'm testing the raw crossover because that's what "Stochastic strategy" usually means on TradingView. The indicator's real-world use (oversold/overbought zones, divergence, higher-timeframe confluence) is a different, more sensible experiment — but every version must answer the same question this post asks: how often do you trade, and can your edge outrun the fees?
- One symbol, one year, defaults (14/3).
- The robust finding needs no more data: above a few hundred round trips a year, your cost model isn't a footnote to the backtest — it's the verdict.
Reproduce it
cd blog-drafts/scripts
python backtest_base.py --strategy stoch --symbol BTCUSDT --interval 1h \
    --start 2023-01-01 --end 2023-12-31 --fee 0.0005 --funding 0.0000125
Data: Binance public API, hourly OHLCV, 8,735 bars. The tables above reproduce exactly from this command.
This is a backtest on historical data, not investment advice. Past performance does not predict future results.