RSI(14) Mean Reversion Backtest on BTC/USDT: 30/70 vs the RSI(2) Nightmare
Traditional RSI(14) mean reversion (30/70) on real hourly BTC/USDT 2023: +17.71% naive, +9.26% with fees/funding, -7.16% at 25bp across just 33 trades. The patient cousin of the RSI(2) strategy from post 08.
RSI(14) Mean Reversion Backtest on BTC/USDT (2023, hourly, real fees)
The RSI(2) post (post 08) was the lab's first knife story: a 269-trade reversion machine that flipped +56.32% naive into -70.39% at 25bp. The most common objection I got was the period — RSI(2) is the degenerate extreme, they said, nobody trades that. Fair. So this post runs the textbook version: RSI(14), buy under 30, sell over 70, the exact recipe from every indicator course on the internet, on the same data. It trades 33 times. And it makes +9.26% after costs in a year the market rose 155%. The honest score: better than RSI(2), still not a living. Strategy Lab #28.
The head-to-head (same year, same engine)
| Strategy | Period | Trades | Naive | Fees+funding | 25bp |
|---|---|---|---|---|---|
| RSI(2) reversion (post 08) | 2 | 269 | +56.32% | +13.64% | -70.39% |
| RSI(14) reversion (this) | 14 | 33 | +17.71% | +9.26% | -7.16% |
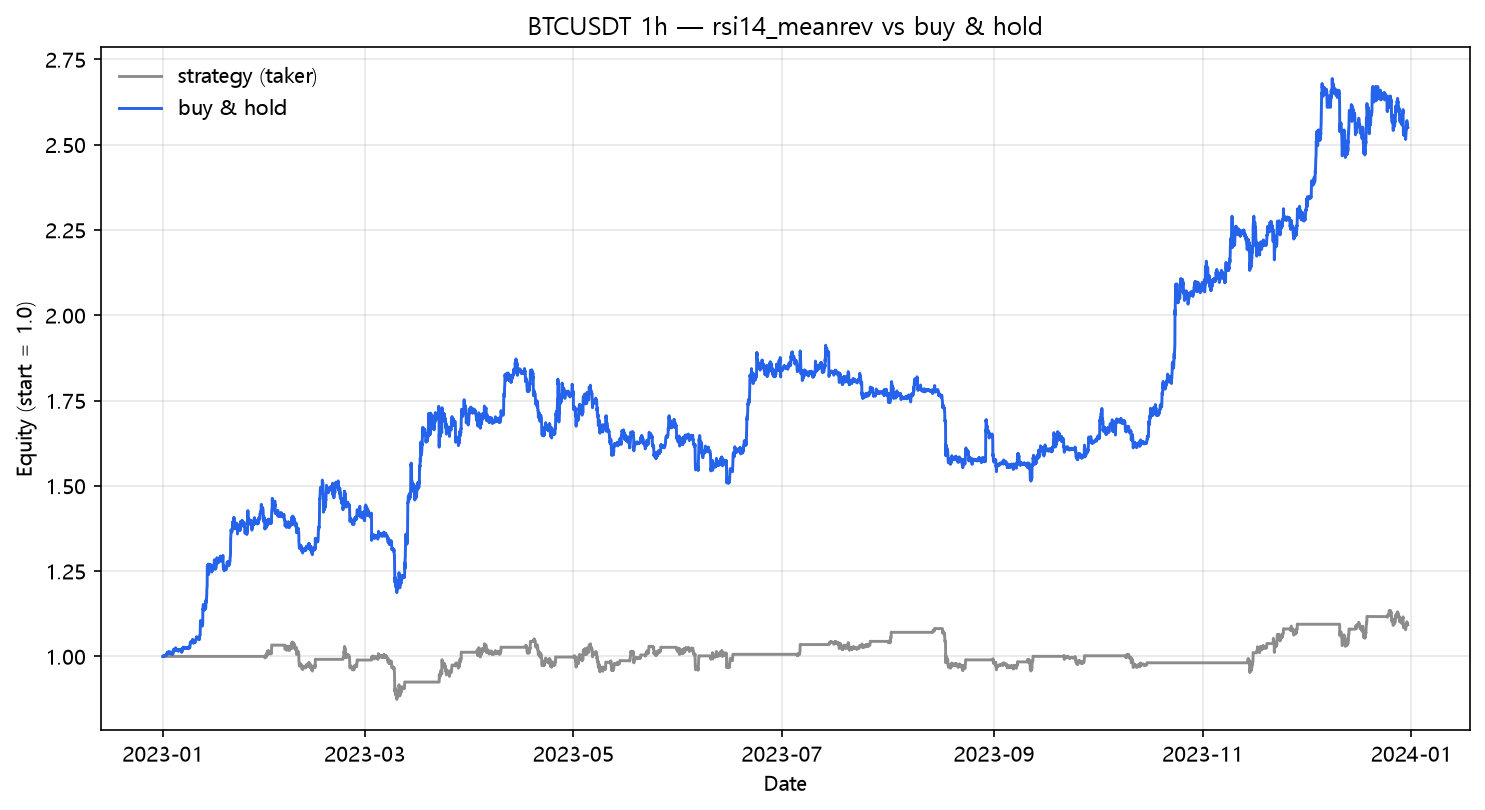
This is the whole story of the period knob. RSI(2) finds more "oversold" moments and more of them are fake; RSI(14) waits for real dislocations and trades almost never. The slow version is more fee-survivable (33 trades, 65 legs) and less profitable gross — it simply doesn't get the volume of good setups. Both lose to buy & hold by an order of magnitude.
Results
| Strategy | Category | Total return | CAGR | MaxDD | Sharpe | Trades |
|---|---|---|---|---|---|---|
| rsi14_meanrev | meanrev | +9.26% | +9.28% | -16.12% | 0.49 | 33 |
The fee bill
| Scenario | Cost/leg | Total return | MaxDD | Sharpe | Trades | |---|---:|---:|---:|---:|---:|---:| | naive (zero cost) | 0.00% | +17.71% | -15.50% | 0.80 | 33 | | taker fee 0.05%/leg | 0.05% | +13.95% | -15.67% | 0.66 | 33 | | + funding 0.01%/8h | 0.05% | +9.26% | -16.12% | 0.49 | 33 | | + slippage 10bp/leg | 0.15% | +2.37% | -16.46% | 0.22 | 33 | | + slippage 25bp/leg | 0.30% | -7.16% | -19.30% | -0.19 | 33 |
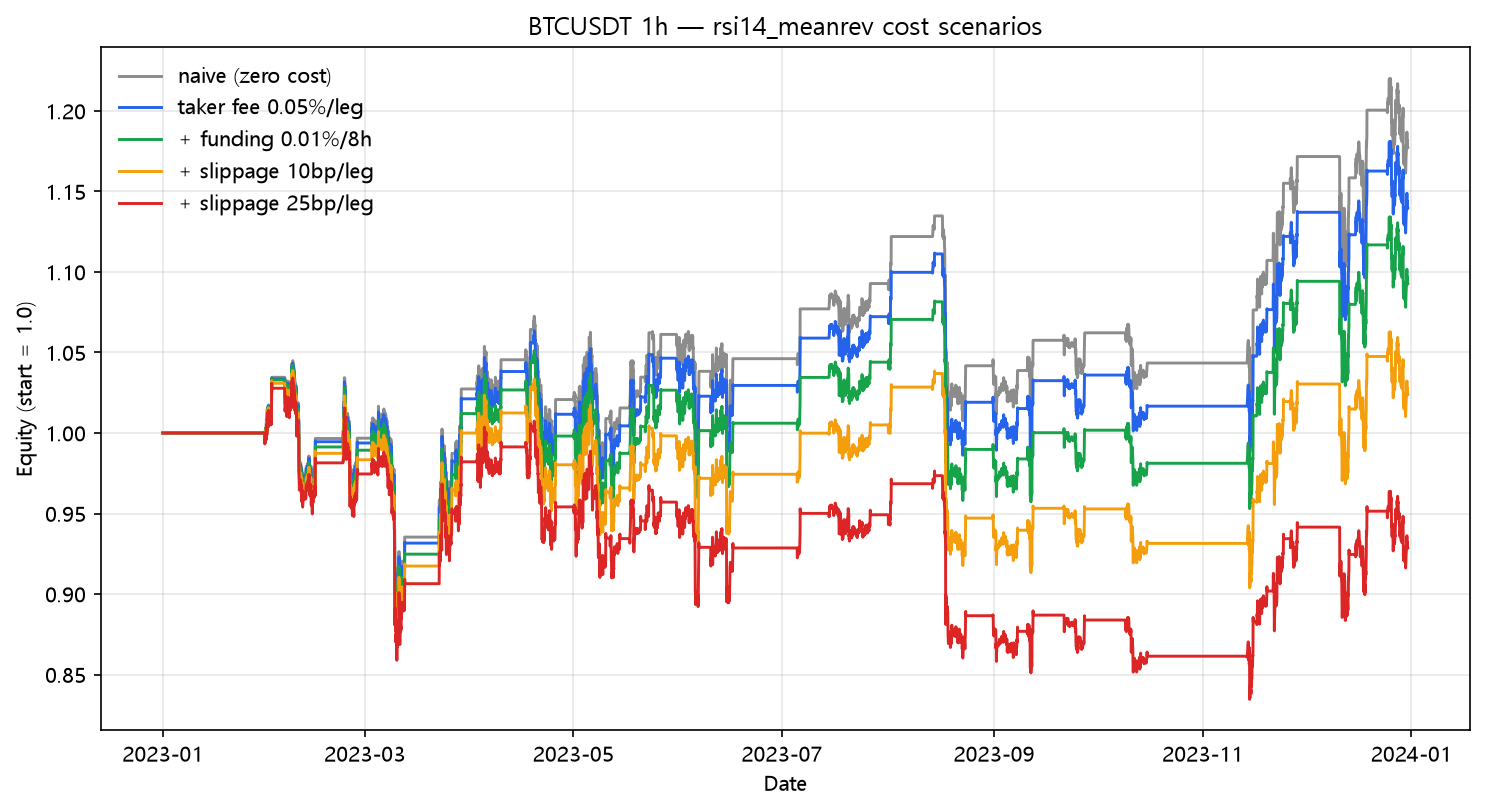
+17.71% → -7.16%. Note what did not happen: no catastrophe. RSI(14)'s 65 legs cost roughly 4% of the account per year, so the columns fall gently — the entire spread from naive to 25bp is about 25 points, versus 127 points for RSI(2). That is what patience buys: not more profit, but stability of the fee bill. The win rate of 60.6% (20/33) is plausible for a reversion rule that waits for real dislocations.
What this does NOT prove
- 33 trades is a small sample; the +9.26% could easily be noise. The shape of the fee table, not the headline number, is the durable finding.
- RSI(14) 30/70 is the default, not an optimum. The band width and the exit rule (30/70 → 40/60) are the real knobs.
- On a range-bound year, the reversion would likely beat buy & hold — 2023's relentless direction is the worst possible weather for it. That's the honest reading, and it's also why I ran it.
Code
from backtest_base import fetch, backtest_signal, metrics

df = fetch("BTCUSDT", "binance", "2023-01-01", "2023-12-31", "1h")
c = df["close"]
delta = c.diff()
up = delta.clip(lower=0).ewm(alpha=1/14, adjust=False).mean()
dn = (-delta.clip(upper=0)).ewm(alpha=1/14, adjust=False).mean()
rsi = 100.0 - 100.0 / (1.0 + up / dn.replace(0.0, np.nan))

enter = (rsi < 30.0).to_numpy()
exit_ = (rsi > 70.0).to_numpy()
position = np.zeros(len(df), dtype=bool)
held = False
for i in range(len(df)):
    if not held and enter[i]:
        held = True
    elif held and exit_[i]:
        held = False
    position[i] = held

signal = pd.Series(position, index=df.index)
res = backtest_signal(df, signal, cost_per_leg=0.0005,
                      funding_per_bar=0.0001 / 8.0)
print(metrics(res, 8760))
Reproduce it
cd blog-drafts/scripts
python backtest_base.py --strategy rsi14_meanrev --symbol BTCUSDT --interval 1h \
    --start 2023-01-01 --end 2023-12-31 --fee 0.0005 --funding 0.0000125
Data: Binance public API, hourly OHLCV, 8,735 bars. The tables above reproduce exactly from this command.
This is a backtest on historical data, not investment advice. Past performance does not predict future results.