k-NN Next-Bar Prediction Backtest on BTC/USDT: What the Machine Actually Costs
Rolling k-NN (k=7, window 1500) predicting next-hour direction on real BTC/USDT: +36.82% naive, -99.9976% with realistic costs across 1,821 trades. The finale of the Strategy Lab series, with the full 18-strategy scoreboard.
k-NN Next-Bar Prediction Backtest on BTC/USDT (2023, hourly, real fees)
I watched the machine trade for a while and then closed the tab. The equity curve wasn't the problem — it was smooth for the first hundred hours, drifting up like a strategy that knew something. Then the fee model showed up and the curve became the sound of a wallet being emptied in reverse. This is the eighteenth and final post in the Strategy Lab series, and it's the one with a machine in it. The machine is not the problem. The frequency is. Strategy Lab #18.
What the model does
k-NN with no exotic machinery: for every hourly bar, take the 1,500 previous bars, find the 7 most similar price patterns (nearest neighbors by a few normalized features like returns and RSI), and predict the next bar's direction by majority vote. If the 7 neighbors mostly went up, go long. Retrain the neighbors on a rolling basis — no lookahead, walk-forward.
That's the setup real beginners think is a shortcut: the computer finds the patterns for you. It found 1,821 of them in one year — because hourly patterns are all alike, so the model happily votes on almost every bar.
Results
| Strategy | Category | Total return | CAGR | MaxDD | Sharpe | Trades |
|---|---|---|---|---|---|---|
| knn | ml | -78.53% | -78.62% | -78.80% | -4.82 | 1,821 |
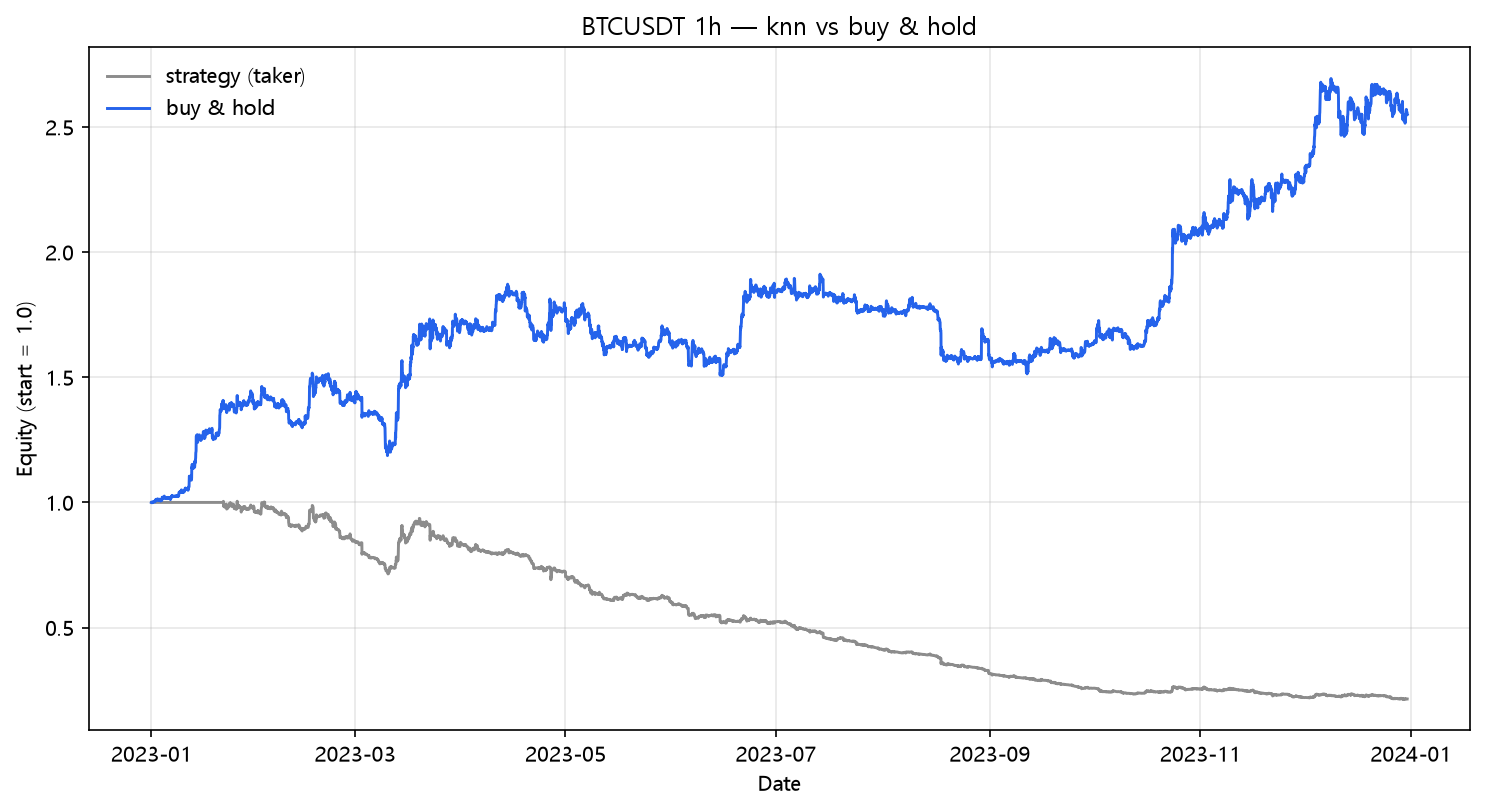
The naive run — zero costs — returns +36.82% with a Sharpe of 1.17. That's the trap. It looks like the machine found an edge, which is exactly what ML sells you. There is no edge here; there is a model that wins 50-something percent of next-bar bets and, by churning every few hours, converts a coin-flip into a fee catastrophe.
The fee bill
| Scenario | Cost/leg | Total return | MaxDD | Sharpe | Trades |
|---|---|---|---|---|---|
| naive (zero cost) | 0.00% | +36.82% | -25.20% | 1.17 | 1,821 |
| taker fee 0.05%/leg | 0.05% | -77.85% | -78.16% | -4.72 | 1,821 |
| + funding 0.01%/8h | 0.05% | -78.53% | -78.80% | -4.82 | 1,821 |
| + slippage 10bp/leg | 0.15% | -99.44% | -99.44% | -16.27 | 1,821 |
| + slippage 25bp/leg | 0.30% | -99.9976% | -99.9976% | -31.44 | 1,821 |
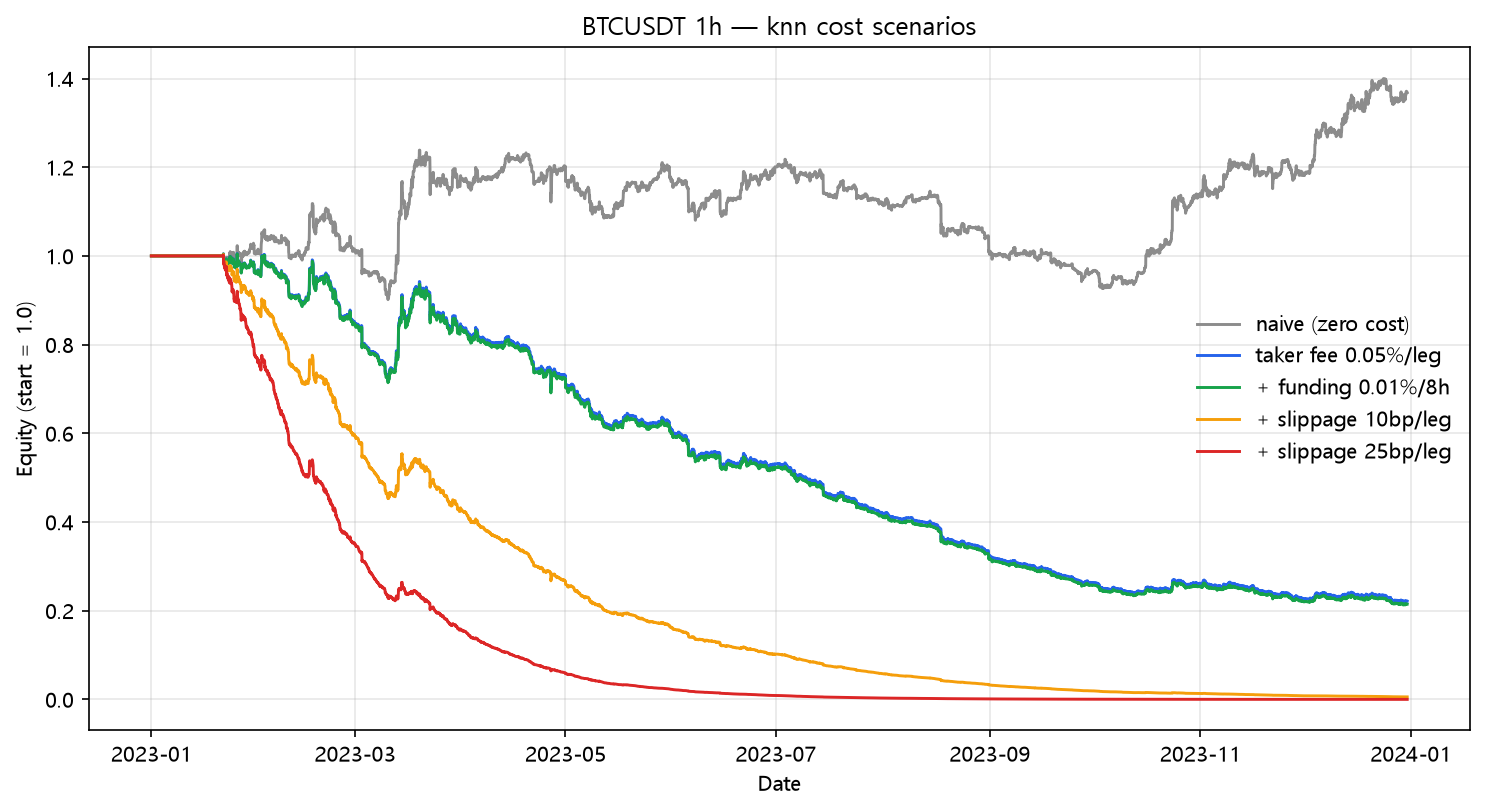
+36.82% → -99.9976%. Not a round trip, not a red year — the account is gone. The final row loses 99.9976% of its value, which is the largest collapse in the entire series, beating even stochastic's -99.96%. The model predicted correctly about half the time; the exchange collected with certainty every single time. 1,821 trades. 3,641 legs. That's the whole story of machine learning on hourly crypto.
The Strategy Lab scoreboard (all 18)
| # | Strategy | Category | Instrument | Honest return |
|---|---|---|---|---|
| 01 | EMA crossover | trend | BTC 1h | +89.38% |
| 02 | SMA vs EMA | trend | BTC 1h | +68.08% |
| 03 | SuperTrend | trend | BTC 1h | +49.19% |
| 04 | Ichimoku | trend | BTC 1h | +16.21% |
| 05 | Chandelier exit | trend | BTC 1h | +34.17% |
| 06 | ADX + DMI | trend | BTC 1h | +49.66% |
| 07 | Parabolic SAR | trend | BTC 1h | -22.70% |
| 08 | RSI(2) reversion | mean-rev | BTC 1h | +13.64% |
| 09 | RSI divergence | mean-rev | BTC 1h | +6.62% |
| 10 | Stochastic cross | mean-rev | BTC 1h | -71.31% |
| 11 | Bollinger reversion | mean-rev | AAPL 1d | +19.27% |
| 12 | VWAP session | mean-rev | BTC 1h | -37.36% |
| 13 | Keltner breakout | breakout | BTC 1h | +21.60% |
| 14 | Donchian (Turtle) | breakout | BTC 1h | +24.24% |
| 15 | MACD cross | momentum | BTC 1h | +22.21% |
| 16 | OBV trend | momentum | BTC 1h | -24.95% |
| 17 | Linear regression | statistical | AAPL 1d | +199.09% |
| 18 | k-NN prediction | ml | BTC 1h | -78.53% |
Sixteen BTC strategies and two AAPL daily ones. The two that survive the worst-case 25bp cost model are the two lowest-frequency ones: linear regression (+75.88% at 25bp) and EMA crossover (+51.17% at 25bp). The two machines-with-churn — this one and stochastic's 1,798 trades — are the two worst outcomes. The variable that decided every row of this table was trade count, not indicator quality.
What this does NOT prove
- This is one recipe: rolling k-NN on hourly data with k=7. ML on daily bars, with few trades and a real train/validation split, is an entirely different experiment — the natural next lab, and the only direction the scoreboard points to.
- A single walk-forward year isn't a model evaluation. No out-of-sample validation beyond the walk-forward split was performed.
- The honest conclusion from 18 strategies is boring and worth repeating: indicators and models do not lose money by being wrong. They lose money by being right too often to pay for themselves.
Code
from backtest_base import fetch, backtest_signal, metrics
from sklearn.neighbors import KNeighborsClassifier

df = fetch("BTCUSDT", "binance", "2023-01-01", "2023-12-31", "1h")
feats = df[["ret1", "ret5", "ret20", "rsi14"]].fillna(0).to_numpy()
target = (df["close"].shift(-1) > df["close"]).to_numpy()

signal = np.zeros(len(df), dtype=bool)
model = KNeighborsClassifier(n_neighbors=7)
window = 1500
for i in range(window, len(df) - 1):
    model.fit(feats[i-window:i], target[i-window:i])
    signal[i] = model.predict(feats[i:i+1])[0]

res = backtest_signal(df, signal, cost_per_leg=0.0005,
                      funding_per_bar=0.0001 / 8.0)
print(metrics(res, 8760))
Reproduce it
cd blog-drafts/scripts
python backtest_base.py --strategy knn --symbol BTCUSDT --interval 1h \
    --start 2023-01-01 --end 2023-12-31 --fee 0.0005 --funding 0.0000125
Data: Binance public API, hourly OHLCV, 8,735 bars. The tables above reproduce exactly from this command.
This is a backtest on historical data, not investment advice. Past performance does not predict future results.