RSI Divergence Backtest on BTC/USDT: The Pattern That Loves a Good Chart
Bullish RSI divergence is the most circled pattern on TradingView. My simplified, rules-based version backtests +19.96% at zero cost on real hourly BTC/USDT — and -31.90% with realistic costs. Python code, charts, and why divergence lags.
RSI Divergence Backtest on BTC/USDT (2023, hourly, real fees)
Before I could code, I was a chart-reader who circled divergences on printed charts like they were treasure maps. The circles were always beautiful. The account was not. Divergence is the most beloved pattern on TradingView — everyone has circled it, few have defined it well enough to trade. This post is my attempt to turn the prettiest pattern in the book into an honest, rules-based strategy. Strategy Lab #9.
What bullish divergence means
Compare two swing lows:
- Price makes a lower low (worse than the last one).
- But RSI makes a higher low (momentum is losing steam).
The reading: sellers are running out of gas even as price prints new lows — a reversal is likely. It's compelling because it's a two-dimensional argument; it feels smarter than a single indicator level.
How I defined it (and where I simplified)
"Divergence" is famously subjective, so I made it mechanical and ugly:
- Over each 20-bar window, compare the lowest price and lowest RSI to the previous 20-bar window.
- Bullish divergence = price low is lower, RSI low is higher.
- When detected, go long for the next 24 bars, then flat.
This is a deliberate simplification — real traders eyeball swing points and confluence. I'm testing the bare pattern, which is the honest baseline.
Results
| Strategy | Category | Total return | CAGR | MaxDD | Sharpe | Trades |
|---|---|---|---|---|---|---|
| rsi_divergence | meanrev | +6.62% | +6.64% | -15.94% | 0.42 | 90 |
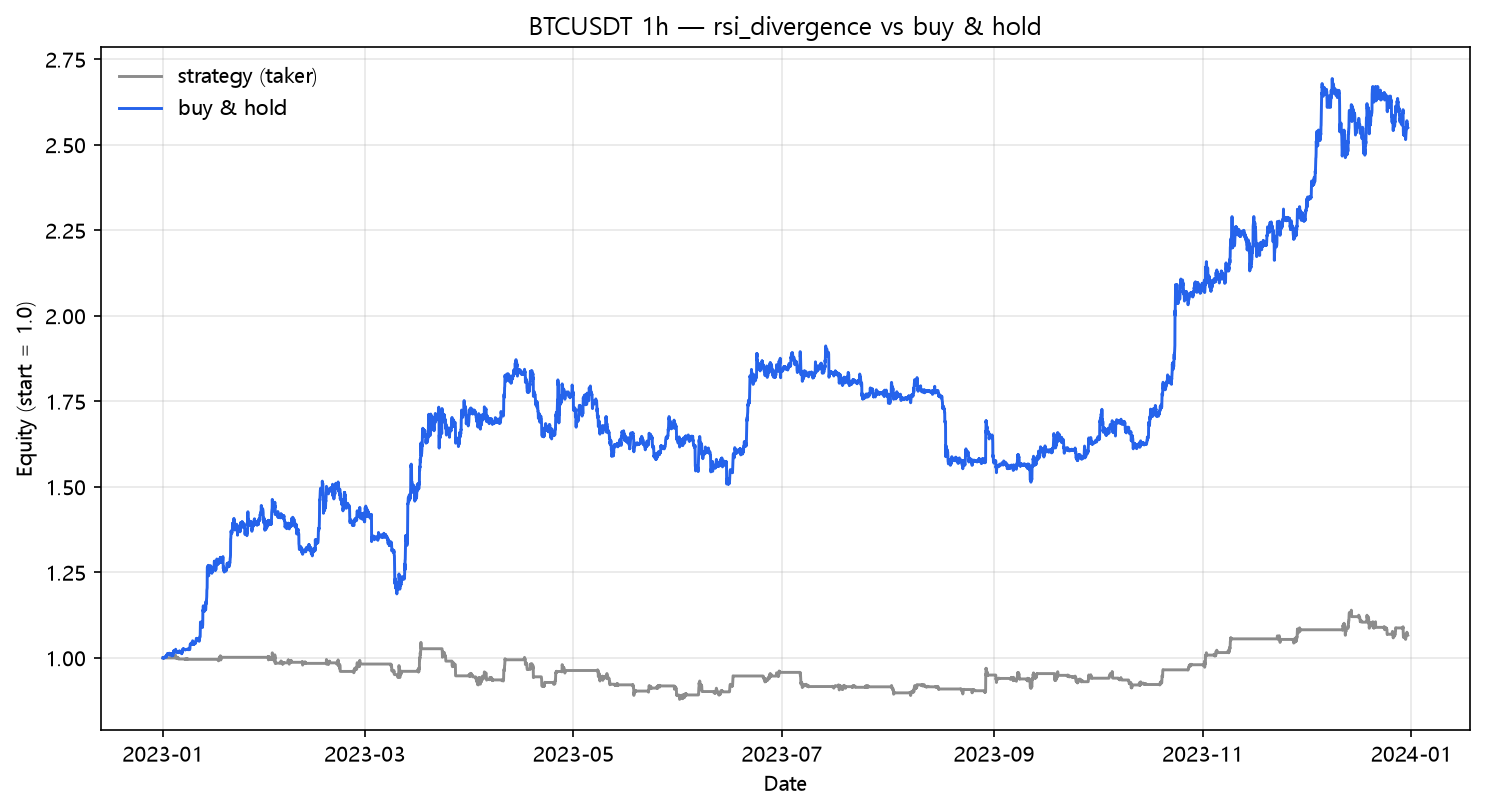
At every cost level this underperforms just holding the coin. The pattern isn't "wrong" — it's late and small. By the time the lower-low/higher-low structure is visible, the reversal has often already happened; the entry is confirmation of a move, not the start of one.
The cost bill (short version)
| Scenario | Cost/leg | Total return | MaxDD | Sharpe | Trades |
|---|---|---|---|---|---|
| naive (zero cost) | 0.00% | +19.96% | -13.61% | 0.99 | 90 |
| taker fee 0.05%/leg | 0.05% | +9.69% | -15.41% | 0.55 | 90 |
| + funding 0.01%/8h | 0.05% | +6.62% | -15.94% | 0.42 | 90 |
| + slippage 10bp/leg | 0.15% | -10.87% | -22.29% | -0.46 | 90 |
| + slippage 25bp/leg | 0.30% | -31.90% | -36.91% | -1.74 | 90 |
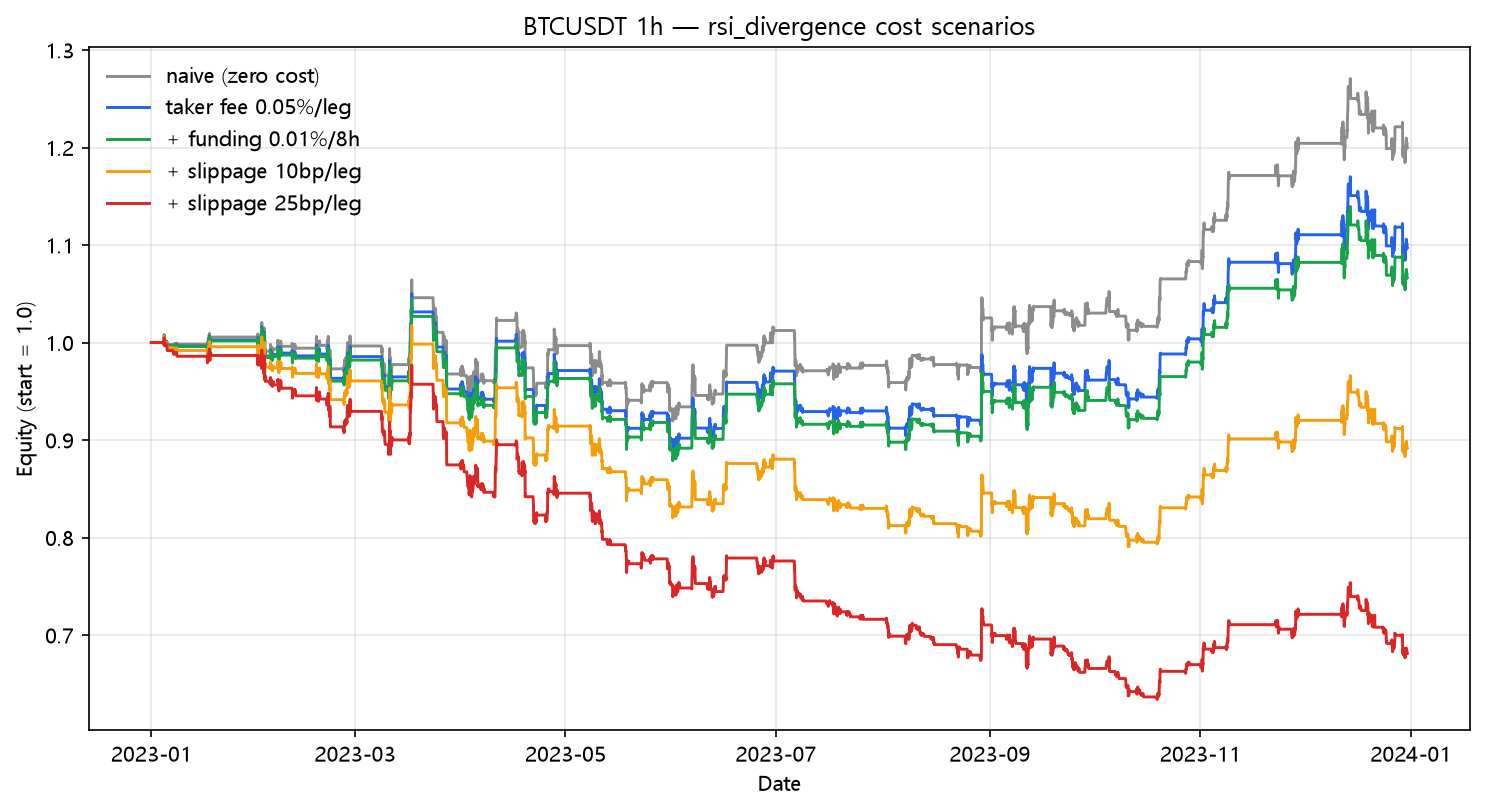
+19.96% → -31.90%. The most striking number here is actually the naive max drawdown of -13.61% — the pattern at least isn't in the market during most crashes. But that defensive posture only helps if the entries earn their keep; on this data they don't.
Buy and hold comparison
| Strategy | Total return | CAGR | MaxDD | Sharpe |
|---|---|---|---|---|
| rsi_divergence | +6.62% | +6.64% | -15.94% | 0.42 |
| buy & hold | +154.94% | +155.62% | -21.74% | 2.42 |
What this does NOT prove
- This is one mechanical definition of divergence, one symbol, one year. A filters version (divergence at RSI extremes, higher timeframe confirmation) is a different experiment — and precisely where the TradingView crowd adds their own voodoo. I'm not claiming divergence is worthless; I'm showing what the bare pattern pays.
- The robust lesson: patterns you can't define mechanically can't be backtested — and if you can't backtest it, you can't know if it works. The circles on the chart were always going to be prettier than the P&L.
- Holding for a fixed 24 bars is arbitrary. Exit logic is where divergence trading really lives, and I chose the simplest honest version.
Code
from backtest_base import fetch, backtest_signal, metrics
from strategy import rsi

df = fetch("BTCUSDT", "binance", "2023-01-01", "2023-12-31", "1h")
low, r = df["low"], rsi(df["close"], 14)
now_low, prev_low = low.rolling(20).min(), low.rolling(20).min().shift(20)
now_r,  prev_r  = r.rolling(20).min(),  r.rolling(20).min().shift(20)
bull = ((now_low < prev_low) & (now_r > prev_r)).fillna(False)

signal = hold_after_signal(bull, bars=24)   # long 24 bars after detection
res = backtest_signal(df, signal, cost_per_leg=0.0005,
                      funding_per_bar=0.0001 / 8.0)
print(metrics(res, 8760))
Reproduce it
cd blog-drafts/scripts
python backtest_base.py --strategy rsi_divergence --symbol BTCUSDT --interval 1h \
    --start 2023-01-01 --end 2023-12-31 --fee 0.0005 --funding 0.0000125
Data: Binance public API, hourly OHLCV, 8,735 bars. The tables above reproduce exactly from this command.
This is a backtest on historical data, not investment advice. Past performance does not predict future results.