Parabolic SAR Backtest on BTC/USDT: 525 Trades and a -94.43% Slip
The Parabolic SAR is a classic trailing-stop indicator. Run it on real hourly BTC/USDT as a strategy and the cost model turns +36.74% at zero cost into -94.43% with realistic taker plus slippage. Full pandas implementation and charts.
Parabolic SAR Backtest on BTC/USDT (2023, hourly, real fees)
I built my own keyboard once, which tells you everything about how I approach problems: when something works, my first instinct is to make it more complicated. The Parabolic SAR is the trading version of that instinct. It's a beautiful little indicator — a dot that chases price and flips when you get too greedy — and I was sure it would make a clean, self-driving strategy. It did not. Strategy Lab #7.
The one table you need to see first
Parabolic SAR flipped 525 times on BTC/USDT in 2023. 1,050 individual legs, each paying fees and slippage. Here is what the same signals earn under different cost assumptions:
| Scenario | Cost/leg | Total return | MaxDD | Sharpe | Trades |
|---|---|---|---|---|---|
| naive (zero cost) | 0.00% | +36.74% | -19.03% | 1.13 | 525 |
| taker fee 0.05%/leg | 0.05% | -19.12% | -39.26% | -0.50 | 525 |
| + funding 0.01%/8h | 0.05% | -22.70% | -40.79% | -0.64 | 525 |
| + slippage 10bp/leg | 0.15% | -72.98% | -75.79% | -3.87 | 525 |
| + slippage 25bp/leg | 0.30% | -94.43% | -94.70% | -8.50 | 525 |
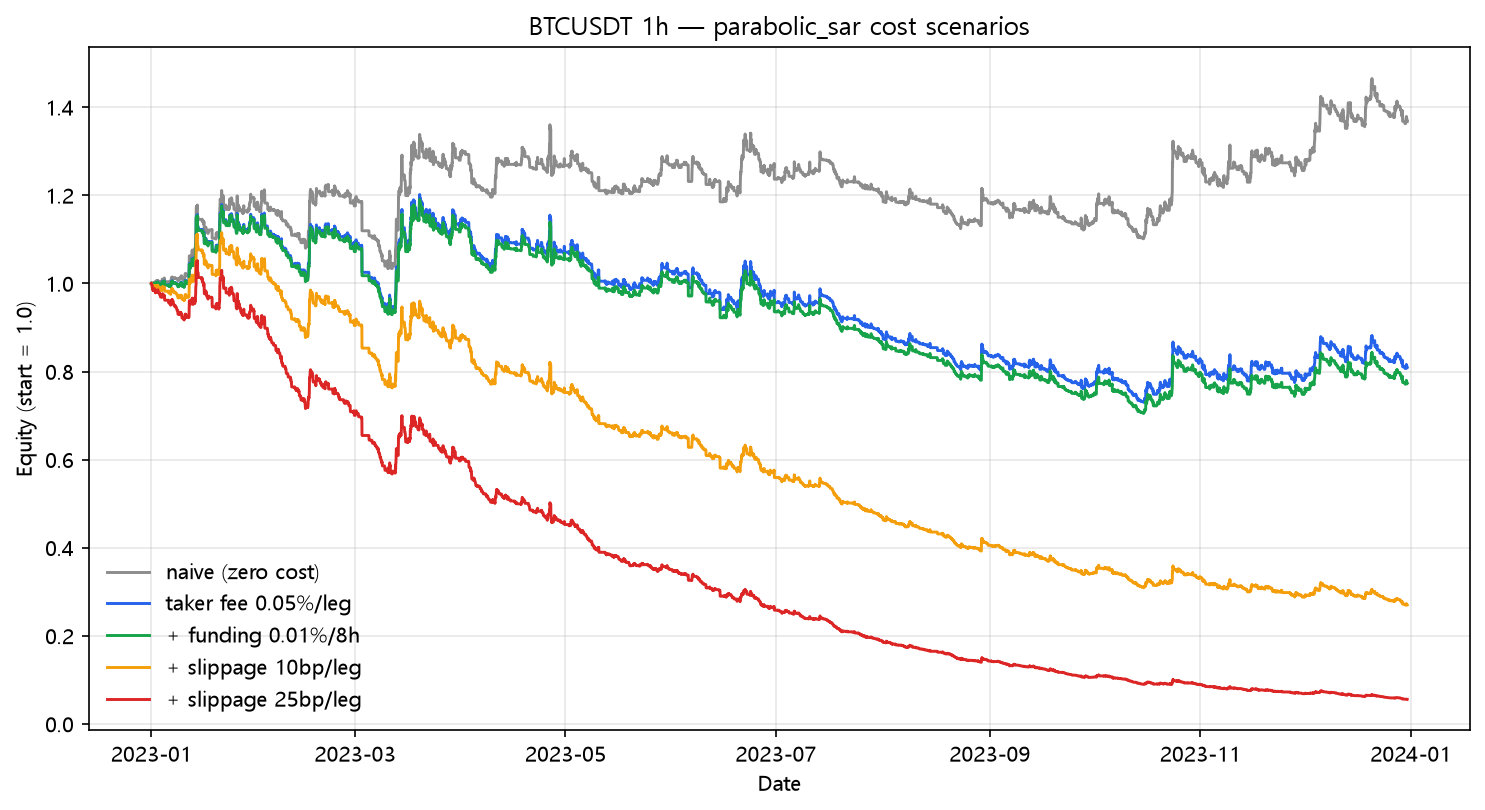
+36.74% → -94.43%. I want to say that slowly, because it's the most extreme case in the whole Strategy Lab series. And even at zero cost this strategy lost to just holding the coin. The naive Sharpe of 1.13 and its tidy -19.03% drawdown are the worst kind of advertisement — they make the disaster below look like a fixable leak. It is not a leak; it's a feature. PSAR's acceleration factor tightens the stop as the trend extends, so the moment a real trend takes a breath, the dot is there to stop you out — then the flip makes you pay again.
How the dot works
Parabolic SAR computes a trailing stop that accelerates:
SAR = previous SAR + acceleration × (extreme − previous SAR)accelerationstarts at 0.02 and rises by 0.02 each time price makes a new extreme, capped at 0.20.
That acceleration is the whole character of the indicator — it rewards momentum by chasing tighter, and punishes pullbacks by being exactly where a pullback lands. On a volatile hourly asset, that's a churn engine.
Results
| Strategy | Category | Total return | CAGR | MaxDD | Sharpe | Trades |
|---|---|---|---|---|---|---|
| parabolic_sar | trend | -22.70% | -22.76% | -40.79% | -0.64 | 525 |
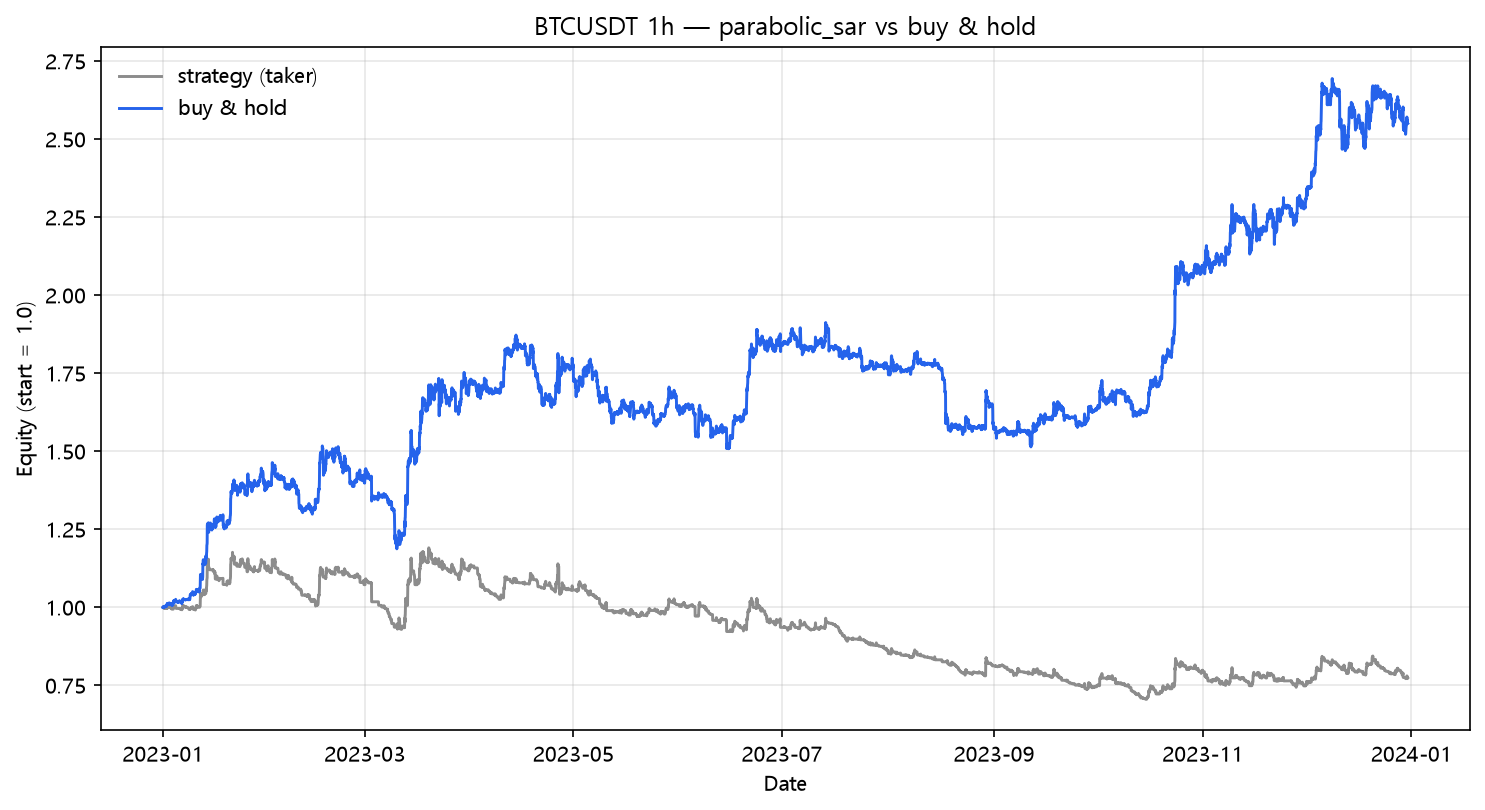
Buy and hold comparison
| Strategy | Total return | CAGR | MaxDD | Sharpe |
|---|---|---|---|---|
| parabolic_sar | -22.70% | -22.76% | -40.79% | -0.64 |
| buy & hold | +154.94% | +155.62% | -21.74% | 2.42 |
What this does NOT prove
- One symbol, one year. On a slower market or a higher timeframe, PSAR's dot is far less suicidal — the timeframe is doing most of the work here.
- The robust, transferable lesson is turnover again, but at the extreme: when your strategy crosses ~500 round trips a year, costs are no longer a detail in the backtest — they are the backtest. Anyone who shows you a PSAR (or any fast-flip) backtest without a fee and slippage column is showing you half the story.
- Defaults (0.02/0.20) are not sacred. Tuning them for this data would be exactly the overfitting this series warns about.
Code
from backtest_base import fetch, backtest_signal, metrics

df = fetch("BTCUSDT", "binance", "2023-01-01", "2023-12-31", "1h")
signal = parabolic_sar(df, step=0.02, max_step=0.2)   # trend True = above SAR

res = backtest_signal(df, signal, cost_per_leg=0.0005,
                      funding_per_bar=0.0001 / 8.0)
print(metrics(res, 8760))
(The full ~40-line PSAR state machine lives in strategy.py — the acceleration ratchet matters, so don't copy a two-line approximation.)
Reproduce it
cd blog-drafts/scripts
python backtest_base.py --strategy parabolic_sar --symbol BTCUSDT --interval 1h \
    --start 2023-01-01 --end 2023-12-31 --fee 0.0005 --funding 0.0000125
Data: Binance public API, hourly OHLCV, 8,735 bars. The tables above reproduce exactly from this command.
This is a backtest on historical data, not investment advice. Past performance does not predict future results.