OBV Backtest on BTC/USDT: When Volume Confirms the Fee Schedule
On-Balance Volume above its EMA is the most trade-hungry strategy in this series: 734 trades, +63.78% at zero cost and -98.10% with realistic costs on real hourly BTC/USDT. The worst fee math in the Strategy Lab series, in pandas with charts.
OBV Backtest on BTC/USDT (2023, hourly, real fees)
"Volume confirms price" is the oldest wisdom on the trading floor, and OBV (On-Balance Volume) is its spreadsheet. Every up close adds the day's volume, every down close subtracts it, and what's left is supposedly the honest flow behind the candles. I wired it up the obvious way — long while OBV sits above its own trendline — and got the most destructive fee math in this whole series. Strategy Lab #16.
What the indicator does
OBV is a running total of volume, signed by the direction of the close:
- Up bar → add volume. Down bar → subtract volume.
- Rule: long while OBV > EMA(20) of OBV.
That's it. The problem is in the plumbing: OBV moves on every single bar, because every bar has a sign. So its EMA crosses its own average constantly — 734 trades in one year of hourly BTC. Everything else in this post is downstream of that number.
Results
| Strategy | Category | Total return | CAGR | MaxDD | Sharpe | Trades |
|---|---|---|---|---|---|---|
| obv | momentum | -24.95% | -25.01% | -42.95% | -0.73 | 734 |
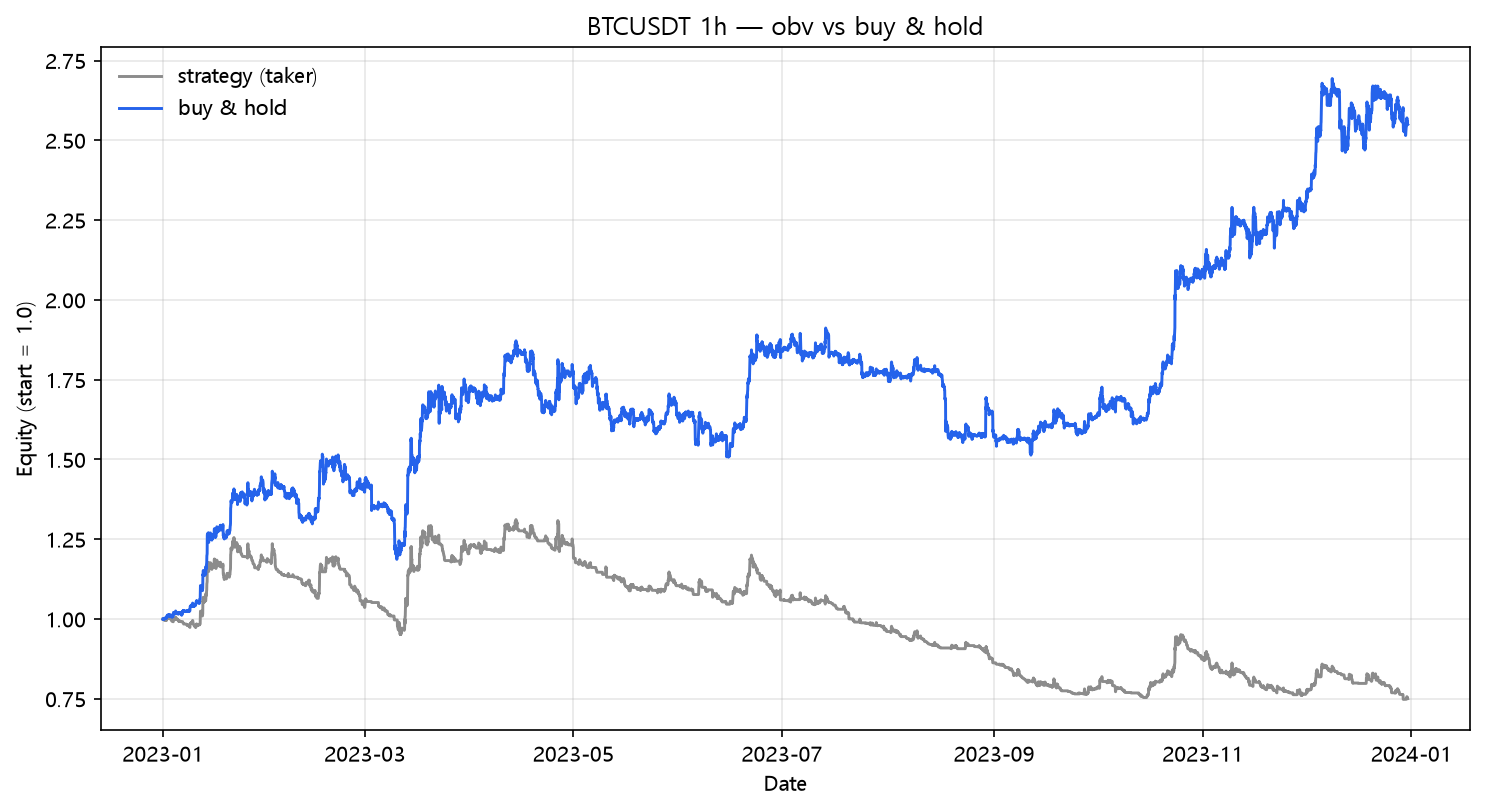
At the honest cost line, the strategy already loses money — and it looks like it should work. OBV above its EMA means you're buying when volume is confirming the direction, the textbook thing. The market then charges you 1,467 legs for the privilege of being right about the direction it was already moving.
The zero-cost version flatters you
| Scenario | Cost/leg | Total return | MaxDD | Sharpe | Trades |
|---|---|---|---|---|---|
| naive (zero cost) | 0.00% | +63.78% | -20.94% | 1.70 | 734 |
| taker fee 0.05%/leg | 0.05% | -21.36% | -41.32% | -0.59 | 734 |
| + funding 0.01%/8h | 0.05% | -24.95% | -42.95% | -0.73 | 734 |
| + slippage 10bp/leg | 0.15% | -82.72% | -85.02% | -5.22 | 734 |
| + slippage 25bp/leg | 0.30% | -98.10% | -98.12% | -11.51 | 734 |
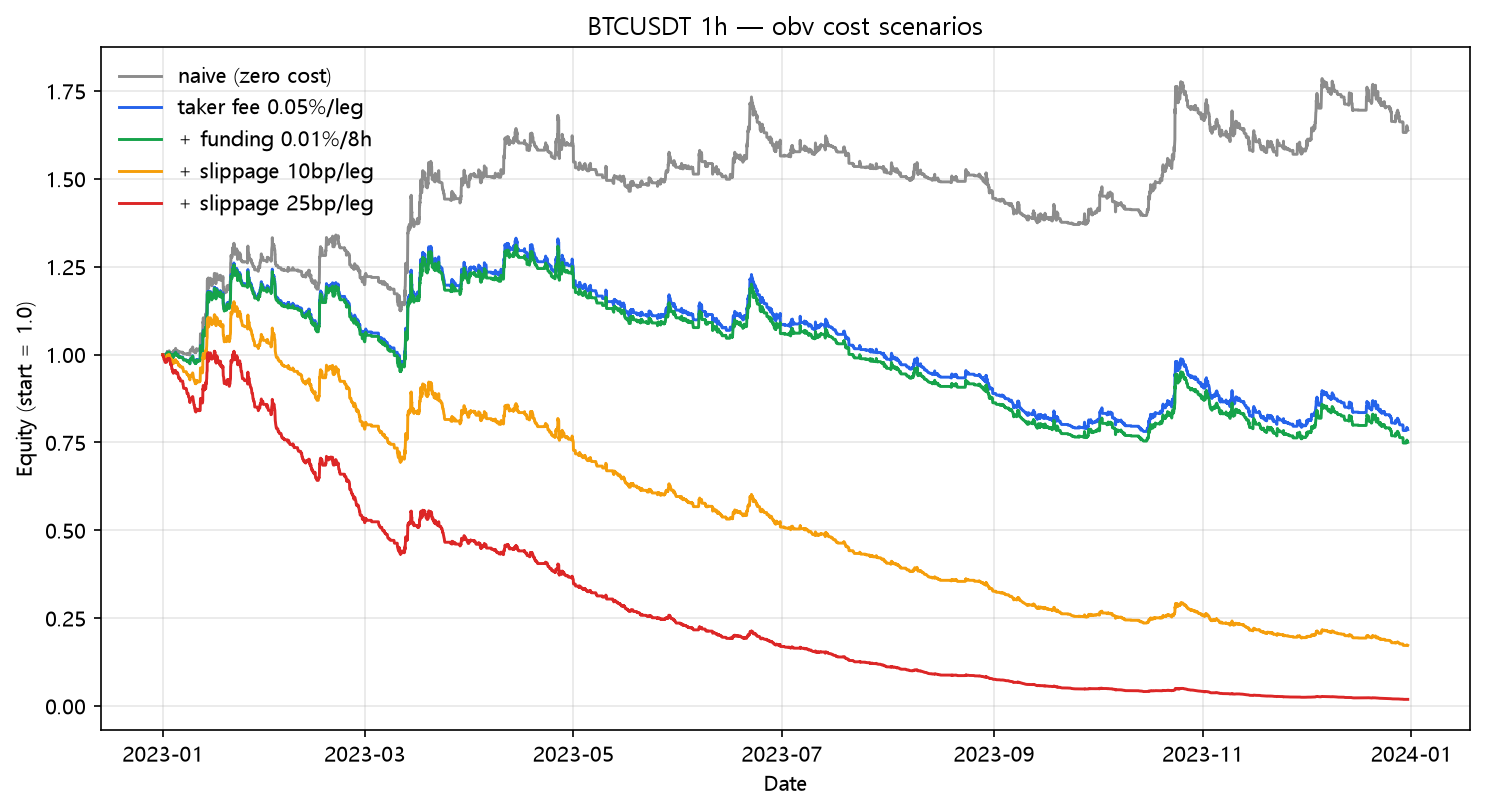
+63.78% → -98.10%. A Sharpe of 1.70 with zero costs — one of the best-looking naive numbers in the series — and the single worst collapse once costs are applied. The Sharpe-to-trade-count rule from the MACD post (#15) applies brutally here: 734 trades is not a strategy, it's a coin being flipped every few hours and paying 5 basis points each flip. The last row has a Sharpe of -11.5. That is not a market signal; that is a fee schedule with a coin on top.
Buy and hold comparison
| Strategy | Total return | CAGR | MaxDD | Sharpe |
|---|---|---|---|---|
| obv | -24.95% | -25.01% | -42.95% | -0.73 |
| buy & hold | +154.94% | +155.62% | -21.74% | 2.42 |
What this does NOT prove
- This is one flavor: OBV vs its own EMA(20). OBV divergence with price is a different, far less frequent signal and wasn't tested here. If volume has an edge, it's likely in divergence (few, meaningful events), not in trend following your own running total.
- The real lesson is structural and applies to all 18 strategies in this lab: any signal derived from a series that flips sign every bar will trade constantly. Trade count is the hidden variable in every backtest that doesn't charge fees. When a naive backtest looks good, check trades — if it's in the hundreds, the fees have already decided the outcome.
- 1h, 2023, BTCUSDT. Fine-grained results won't port to daily stocks or other years; the trade-count logic will.
Code
from backtest_base import fetch, backtest_signal, metrics

df = fetch("BTCUSDT", "binance", "2023-01-01", "2023-12-31", "1h")
sign = df["close"].diff().map(lambda d: 1.0 if d > 0 else (-1.0 if d < 0 else 0.0))
obv = (df["volume"] * sign).cumsum()
trend = obv.ewm(span=20, adjust=False).mean()

signal = (obv > trend).fillna(False)
res = backtest_signal(df, signal, cost_per_leg=0.0005,
                      funding_per_bar=0.0001 / 8.0)
print(metrics(res, 8760))
Reproduce it
cd blog-drafts/scripts
python backtest_base.py --strategy obv --symbol BTCUSDT --interval 1h \
    --start 2023-01-01 --end 2023-12-31 --fee 0.0005 --funding 0.0000125
Data: Binance public API, hourly OHLCV, 8,735 bars. The tables above reproduce exactly from this command.
This is a backtest on historical data, not investment advice. Past performance does not predict future results.