Chandelier Exit Backtest on BTC/USDT: The Exit IS the Strategy
Donchian breakout entry plus an ATR trailing stop — Chuck LeBeau's Chandelier Exit. Real hourly BTC/USDT backtest: +34.17% with fees, -13.87% with realistic slippage, and 89 trades that show exactly where trailing stops bleed. Pandas code.
Chandelier Exit Backtest on BTC/USDT (2023, hourly, real fees)
I once watched a position I genuinely believed in get stopped out by a trailing stop, and then watched the same price run up 60% without me. I spent that night convinced trailing stops were a conspiracy by the market to make me miss moves. The truth was simpler: my exit was wrong, and the exit is most of the strategy. Chuck LeBeau's Chandelier Exit was invented for exactly this fight. Strategy Lab #5.
How the Chandelier Exit works
The Chandelier Exit is a trailing stop built from ATR:
- Entry: classic breakout — close above the highest high of the previous 22 bars.
- Trail: the stop sits
3 × ATR(22)below the highest close since entry. As price makes new highs the stop ratchets up; it never comes back down. - Exit: when the close drops below the stop.
The name comes from the mental image — the stop hangs like a chandelier below the ceiling of the move. Everything that makes it "good" (it rides trends and stays out of small noise) is really about the ATR distance. Too tight and you're a machine for donating fees; too wide and you give back the whole move.
Results
| Strategy | Category | Total return | CAGR | MaxDD | Sharpe | Trades |
|---|---|---|---|---|---|---|
| chandelier | trend | +34.17% | +34.28% | -30.44% | 1.08 | 89 |
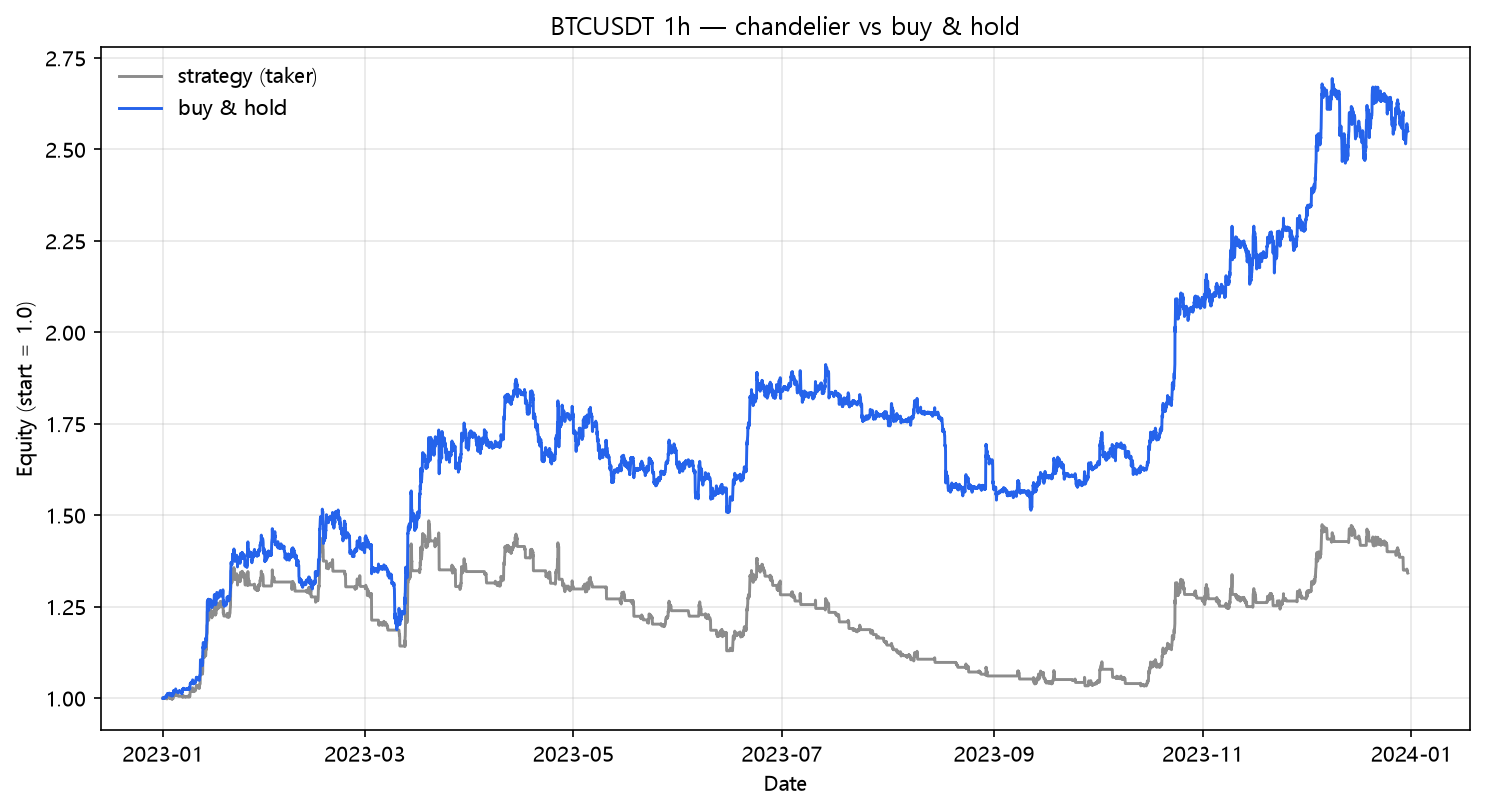
89 trades is a lot for a "ride the trend" strategy, which tells you how often the trailing stop got tagged in BTC's hourly chop before a real trend began. The trailing stop converts an uptrend into a series of smaller round trips — that's the fee machine I mentioned. On one year of this data, the stops that "protected" me were the same stops keeping me out of the biggest leg.
The trailing stop's fee bill
| Scenario | Cost/leg | Total return | MaxDD | Sharpe | Trades |
|---|---|---|---|---|---|
| naive (zero cost) | 0.00% | +53.90% | -25.35% | 1.51 | 89 |
| taker fee 0.05%/leg | 0.05% | +40.86% | -28.91% | 1.23 | 89 |
| + funding 0.01%/8h | 0.05% | +34.17% | -30.44% | 1.08 | 89 |
| + slippage 10bp/leg | 0.15% | +12.38% | -37.44% | 0.53 | 89 |
| + slippage 25bp/leg | 0.30% | -13.87% | -47.05% | -0.30 | 89 |
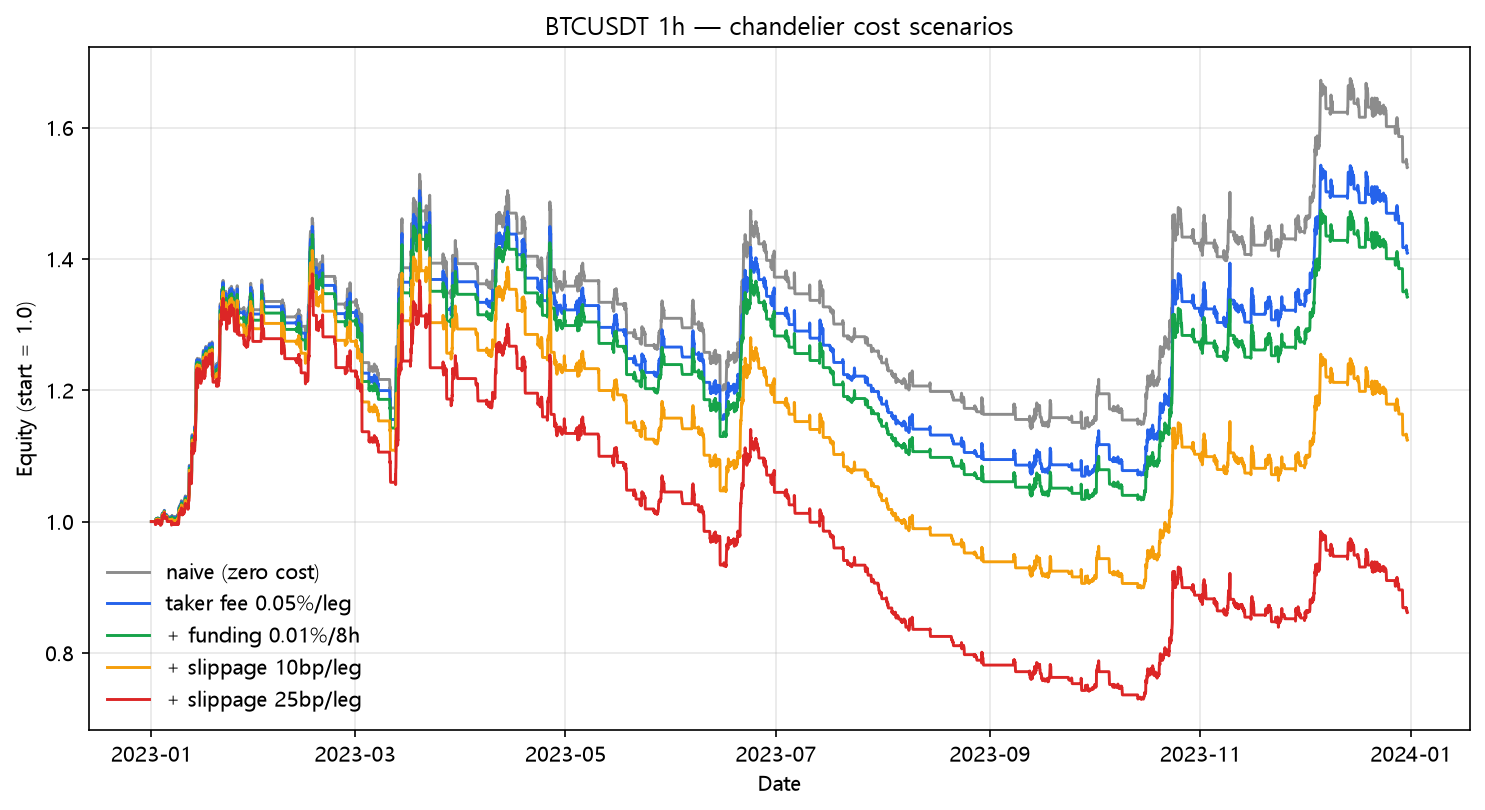
There's the whole argument about trailing stops in one table. The stop is supposed to limit losses, yet the strategy's drawdown actually grows as costs rise — because the exit distance (3×ATR) was sized for a world without slippage. Every re-entry after a stop-out pays the market spread, and a stop-out that follows a fresh entry pays it twice in a few hours. A trailing stop is a risk tool, not a free ride.
Buy and hold comparison
| Strategy | Total return | CAGR | MaxDD | Sharpe |
|---|---|---|---|---|
| chandelier | +34.17% | +34.28% | -30.44% | 1.08 |
| buy & hold | +154.94% | +155.62% | -21.74% | 2.42 |
In a year where the underlying doubled, a stop-happy strategy gives up most of it. The honest reading: Chandelier's real job is not losing everything in a crash — a job 2023 never asked it to do. Its defense looks useless precisely because the threat never arrived. That's the trap of judging a risk strategy by a single good year.
What this does NOT prove
- One symbol, one year, 89 trades.
- ATR(22)×3 is one point in a big space. The whole personality of this strategy lives in the multiplier — 2× would stop out earlier, 4× would hold longer. I ran the defaults; the post is about how the exit behaves, not a claim that 3 is optimal.
- 2023 never tested the drawdown defense Chandelier is built for. A 2022-style bear year is the experiment that would actually show its value — worth a dedicated post.
Code
from backtest_base import fetch, backtest_signal, metrics

df = fetch("BTCUSDT", "binance", "2023-01-01", "2023-12-31", "1h")
close = df["close"]
enter = (close > df["high"].rolling(22).max().shift(1)).to_numpy()
stop = close.rolling(22).max() - atr(df, 22) * 3
exit_ = (close < stop).to_numpy()

signal = stateful_position(enter, exit_)   # enter -> long, exit_ -> flat
res = backtest_signal(df, signal, cost_per_leg=0.0005,
                      funding_per_bar=0.0001 / 8.0)
print(metrics(res, 8760))
Reproduce it
cd blog-drafts/scripts
python backtest_base.py --strategy chandelier --symbol BTCUSDT --interval 1h \
    --start 2023-01-01 --end 2023-12-31 --fee 0.0005 --funding 0.0000125
Data: Binance public API, hourly OHLCV, 8,735 bars. The tables above reproduce exactly from this command.
This is a backtest on historical data, not investment advice. Past performance does not predict future results.