Donchian Breakout Backtest on BTC/USDT: The Famous Turtle System, Run Honestly
The Turtle system is the most famous trading legend ever. Its core Donchian breakout on real hourly BTC/USDT: +44.11% at zero cost, -21.04% with realistic fees — and a -41.90% drawdown. What the legend leaves out, in pandas with charts.
Donchian Breakout Backtest on BTC/USDT (2023, hourly, real fees)
I read the Turtle story on a flight to Lisbon and spent the whole landing daydreaming about strangers getting paid millions to follow a printed rulebook. The legend is real: in the 1980s, Richard Dennis trained a group of novices on a set of breakout rules and they made hundreds of millions. What the legend doesn't tell you is how much of the money came from rules that aren't the breakout. This post is the breakout alone, run honestly. Strategy Lab #14.
The rules, stripped to the bone
The Turtle entry was a Donchian breakout:
- Buy when the close exceeds the highest high of the previous 20 bars.
- Exit when the close falls below the lowest low of the previous 20 bars.
I use a single 20-bar period for both entry and exit — the classic "channel" reading. On BTC/USDT, hourly, 2023, that produced 91 round trips. (The real Turtles also ran a faster 10-day system, traded dozens of markets, pyramided, and sized each position at a fixed 2% risk. All of that is system; this post tests only the raw signal.)
Results
| Strategy | Category | Total return | CAGR | MaxDD | Sharpe | Trades |
|---|---|---|---|---|---|---|
| donchian | breakout | +24.24% | +24.32% | -41.90% | 0.81 | 91 |
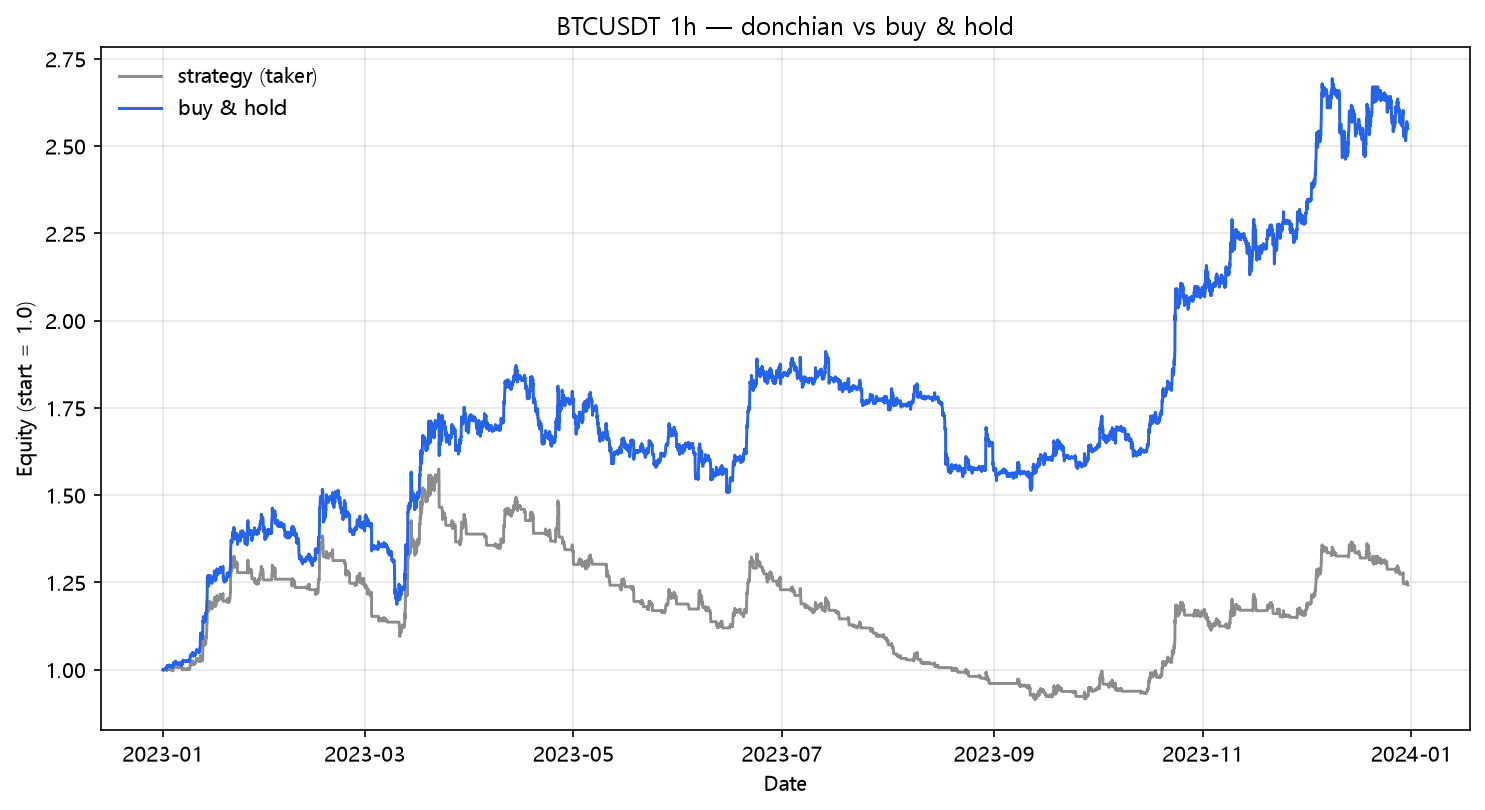
91 trades, positive in every cost scenario until the worst, and yet: -41.90% max drawdown on a year the underlying went up 155%. The channel does what channels do — it waits for a confirmed 20-bar extreme, which on hourly BTC means it buys late and exits late, and the same breakout that catches a real trend also catches every fake one.
The fee bill
| Scenario | Cost/leg | Total return | MaxDD | Sharpe | Trades |
|---|---|---|---|---|---|
| naive (zero cost) | 0.00% | +44.11% | -37.37% | 1.25 | 91 |
| taker fee 0.05%/leg | 0.05% | +31.63% | -40.55% | 0.98 | 91 |
| + funding 0.01%/8h | 0.05% | +24.24% | -41.90% | 0.81 | 91 |
| + slippage 10bp/leg | 0.15% | +3.65% | -47.92% | 0.28 | 91 |
| + slippage 25bp/leg | 0.30% | -21.04% | -55.86% | -0.53 | 91 |
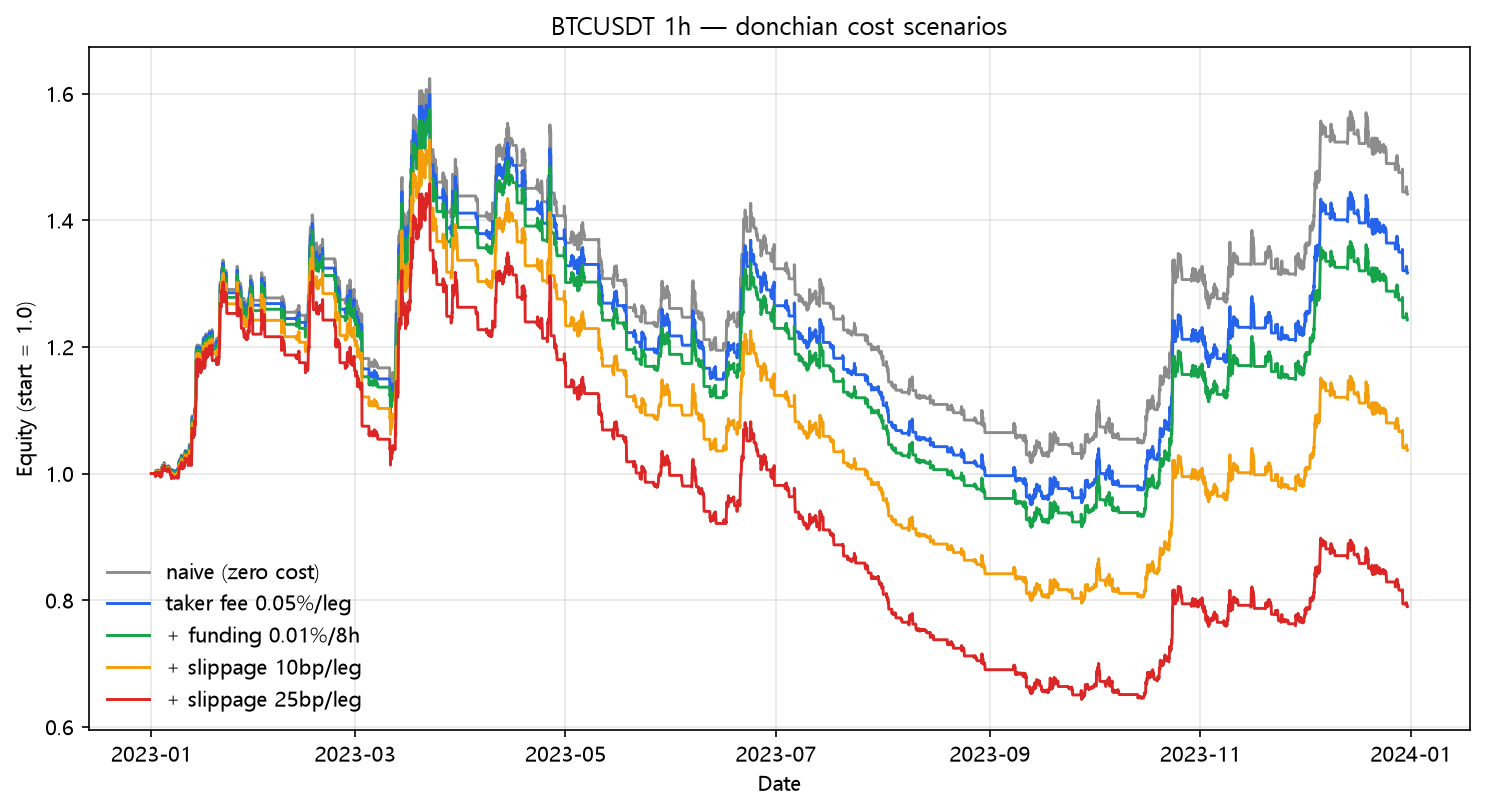
+44.11% → -21.04%. There it is again — the breakout edge evaporates once you pay for the false breakouts. The channel is designed to be wrong often and right rarely; that design only pays when the right trades are huge. On a single hourly market, the huge trades aren't big enough to pay for 181 legs of fees and a -41.90% hole.
Buy and hold comparison
| Strategy | Total return | CAGR | MaxDD | Sharpe |
|---|---|---|---|---|
| donchian | +24.24% | +24.32% | -41.90% | 0.81 |
| buy & hold | +154.94% | +155.62% | -21.74% | 2.42 |
What this does NOT prove
- The legend was about a portfolio, not a signal. The Turtles' edge came from diversification across markets and disciplined sizing — they could be wrong 60% of the time and still win because their winners lived in commodities that trended for years. Tested on one hourly symbol with no sizing, the breakout is a different (worse) animal. This post is the missing chapter of the legend, not a debunking of it.
- 20/20 is one channel width. The Turtles themselves used 20/10; the split between entry and exit periods changes everything about drawdown.
- One year, one symbol. Real breakout systems are judged over decades and many markets.
Code
from backtest_base import fetch, backtest_signal, metrics

df = fetch("BTCUSDT", "binance", "2023-01-01", "2023-12-31", "1h")
close = df["close"]
upper = df["high"].rolling(20).max().shift(1)   # prior 20-bar high
lower = df["low"].rolling(20).min().shift(1)    # prior 20-bar low

enter = (close > upper).to_numpy()
exit_ = (close < lower).to_numpy()
signal = stateful_position(enter, exit_)

res = backtest_signal(df, signal, cost_per_leg=0.0005,
                      funding_per_bar=0.0001 / 8.0)
print(metrics(res, 8760))
Reproduce it
cd blog-drafts/scripts
python backtest_base.py --strategy donchian --symbol BTCUSDT --interval 1h \
    --start 2023-01-01 --end 2023-12-31 --fee 0.0005 --funding 0.0000125
Data: Binance public API, hourly OHLCV, 8,735 bars. The tables above reproduce exactly from this command.
This is a backtest on historical data, not investment advice. Past performance does not predict future results.