Aroon Backtest on BTC/USDT: 214 Trades and the Highest Win Rate in the Trend Lab
The Aroon Up/Down indicator as a strategy on real hourly BTC/USDT 2023: +65.23% naive, +26.93% with fees and funding, -56.54% at 25bp. The only trend strategy here with a 66.8% win rate — and why that's a warning, not a prize.
Aroon Backtest on BTC/USDT (2023, hourly, real fees)
Aroon answers a specific question: how long ago did the highest high (or lowest low) of the last N bars happen? Aroon Up = 100 × (N − bars since the N-bar high) / N. If Up > Down, the market spent more of the recent window making new highs than new lows, and the traditional reading is "uptrend." I turned that single line of logic into a long-only strategy on hourly BTC/USDT and got the strangest result of the trend family: the highest win rate of any trend strategy in the lab, and a fee bill that still eats it alive. Strategy Lab #23.
The checklist I ran (T2 template)
- Rule — long when Aroon Up(25) > Aroon Down(25). One line of logic, no exit filter.
- Data — Binance BTCUSDT, 1h, 2023-01-01 → 2023-12-30, 8,735 bars.
- Cost model — the standard five: naive, taker 0.05%/leg, +funding, +10bp, +25bp.
- Hypothesis — a momentum-of-extremes filter should stay long through real trends and avoid chop.
- Question — does a high win rate survive the fee bill?
Results
| Strategy | Category | Total return | CAGR | MaxDD | Sharpe | Trades |
|---|---|---|---|---|---|---|
| aroon | trend | +26.93% | +27.02% | -15.77% | 1.04 | 214 |
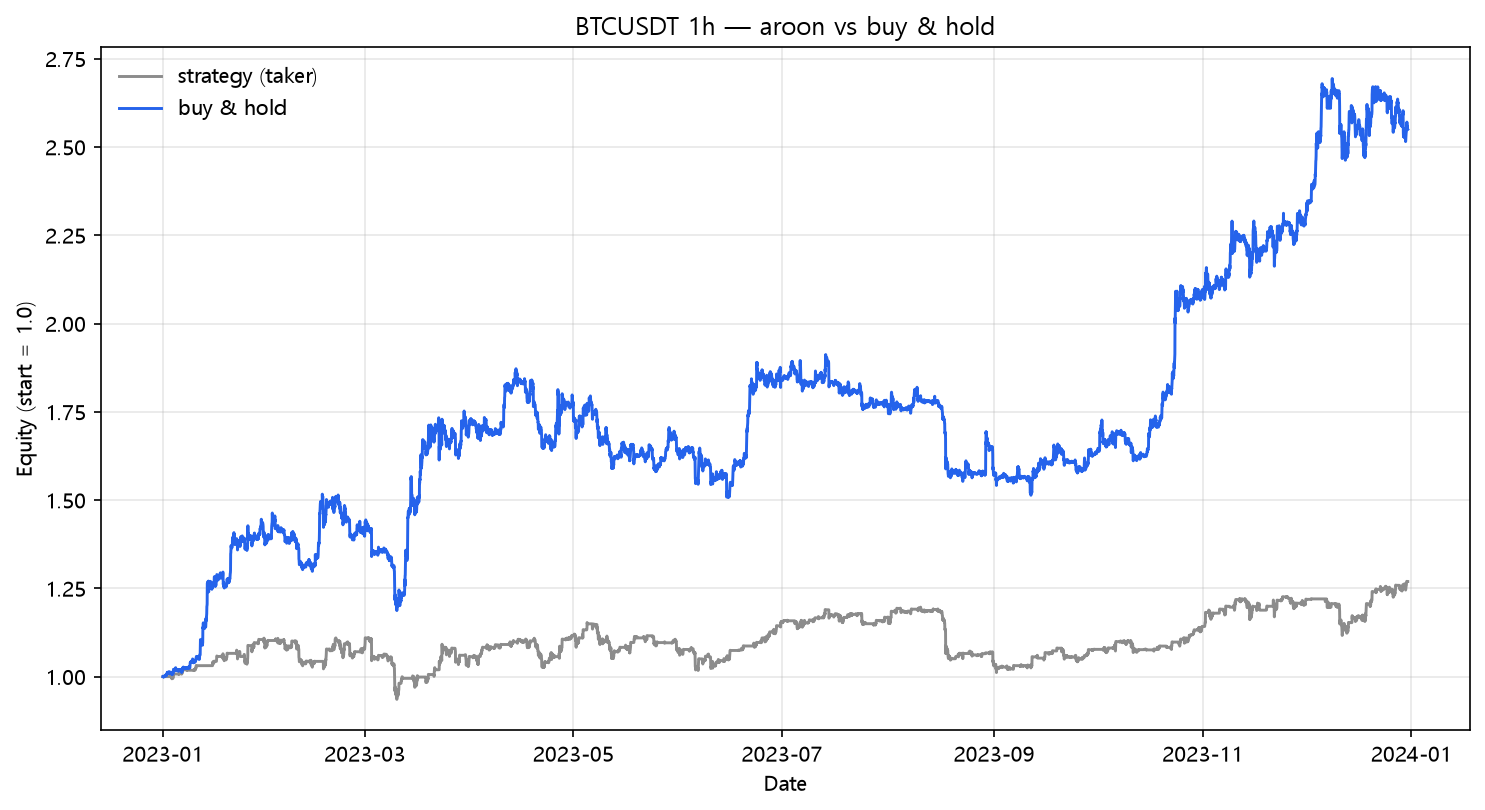
Naive Aroon made +65.23% with the tightest drawdown of the trend group so far (-15.11%). But 214 trades is a lot of round trips for a trend strategy — nearly three times the EMA's 45. Aroon flips whenever the bars-since-extreme race changes leader, which on an hourly tape happens constantly. High win rate (66.8% — 143/214) is exactly what that kind of churn produces: lots of small wins, all of them trimmed by the fee bill.
The fee bill
| Scenario | Cost/leg | Total return | MaxDD | Sharpe | Trades | |---|---:|---:|---:|---:|---:|---:| | naive (zero cost) | 0.00% | +65.23% | -15.11% | 2.04 | 214 | | taker fee 0.05%/leg | 0.05% | +33.39% | -15.61% | 1.23 | 214 | | + funding 0.01%/8h | 0.05% | +26.93% | -15.77% | 1.04 | 214 | | + slippage 10bp/leg | 0.15% | -17.30% | -30.62% | -0.58 | 214 | | + slippage 25bp/leg | 0.30% | -56.54% | -60.42% | -2.95 | 214 |
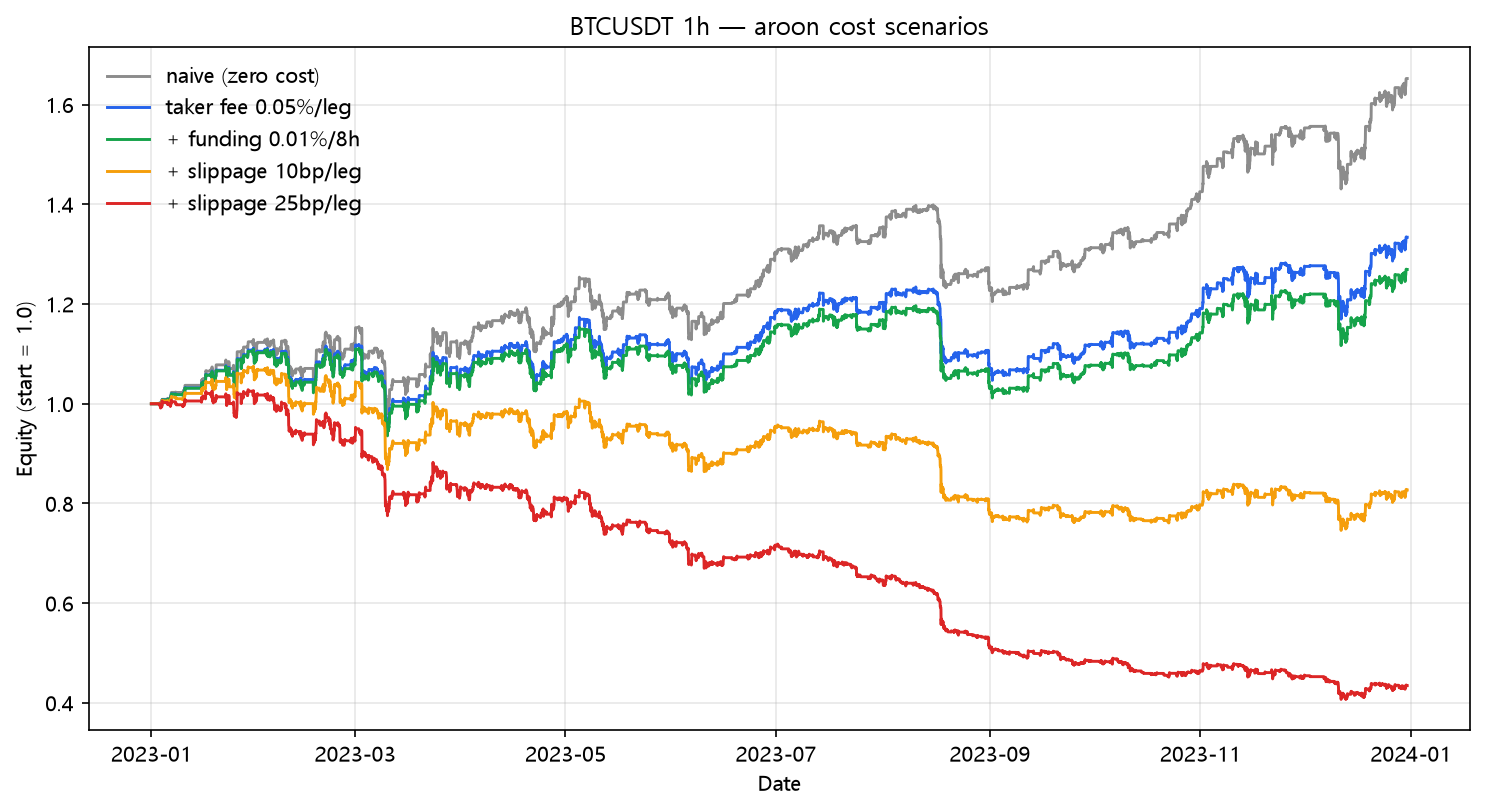
+65.23% → -56.54%. Here's the lesson wrapped in a table: a 66.8% win rate is not an edge, it's a distribution. When two-thirds of your trades are small wins and the occasional big loss still marks the year, the fee bill converts your frequency into a subscription payment. 428 legs at 25bp is 26.75% of principal handed to the market, every year, before the first coin moves. Compare with the EMA crossover (post 01): 45 trades total — and it's the winner at the 25bp column (+51.17%). High win rate + high frequency is the most expensive combination in this entire lab.
What this does NOT prove
- Aroon is a perfectly fine filter (e.g., "only take longs when Aroon agrees") — this test punished it as a standalone switch.
- The 25/25/25 parameters are the standard defaults; Aroon's sensitivity to N is worth its own scan.
- 2023 again: one year. Aroon's tight drawdown profile might be worth more in a bear year than the raw return suggests.
Code
from backtest_base import fetch, backtest_signal, metrics

df = fetch("BTCUSDT", "binance", "2023-01-01", "2023-12-31", "1h")
h, l = df["high"], df["low"]
period = 25

argmax = h.rolling(period).apply(lambda a: float(np.argmax(a)), raw=True)
argmin = l.rolling(period).apply(lambda a: float(np.argmin(a)), raw=True)
up   = 100.0 * (period - 1 - argmax) / period
down = 100.0 * (period - 1 - argmin) / period

signal = (up > down).fillna(False)
res = backtest_signal(df, signal, cost_per_leg=0.0005,
                      funding_per_bar=0.0001 / 8.0)
print(metrics(res, 8760))
Reproduce it
cd blog-drafts/scripts
python backtest_base.py --strategy aroon --symbol BTCUSDT --interval 1h \
    --start 2023-01-01 --end 2023-12-31 --fee 0.0005 --funding 0.0000125
Data: Binance public API, hourly OHLCV, 8,735 bars. The tables above reproduce exactly from this command.
This is a backtest on historical data, not investment advice. Past performance does not predict future results.