ADX/DMI Backtest on BTC/USDT: A Trend Filter That Churns 216 Times
The ADX trend filter everyone adds to 'confirm' a move. On real hourly BTC/USDT data it returns +92.23% at zero cost — and -49.27% with realistic taker plus slippage. Pandas implementation, charts, and why filters add lag.
ADX/DMI Backtest on BTC/USDT (2023, hourly, real fees)
I check ADX every morning with my coffee, and I used to trust it the way you trust a label that says "new and improved." It has "trend" in the name, so surely it knows when a trend is real. Then I ran it as an actual strategy instead of a decoration on my chart, and the whole thing came apart in the cost model. ADX is a filter — and filters don't fix choppy markets, they just add lag. Strategy Lab #6.
What ADX/DMI actually measures
The Directional Movement system splits each bar into directional movement:
- +DM when price went up more than it went down; −DM when the opposite.
- +DI / −DI smooth those into directional indicators relative to ATR.
- ADX smooths the gap between the DIs — a number that says "how much the trend is trending," regardless of direction.
My strategy rule was the classic filter: long when +DI > −DI and ADX > 20. On the surface it reads like a mature, careful strategy. In reality, on hourly BTC, it spent the year flipping on and off as the DIs tangled — 216 times.
The zero-cost fantasy
| Strategy | Category | Total return | CAGR | MaxDD | Sharpe | Trades |
|---|---|---|---|---|---|---|
| adx | trend | +49.66% | +49.84% | -29.92% | 1.53 | 216 |
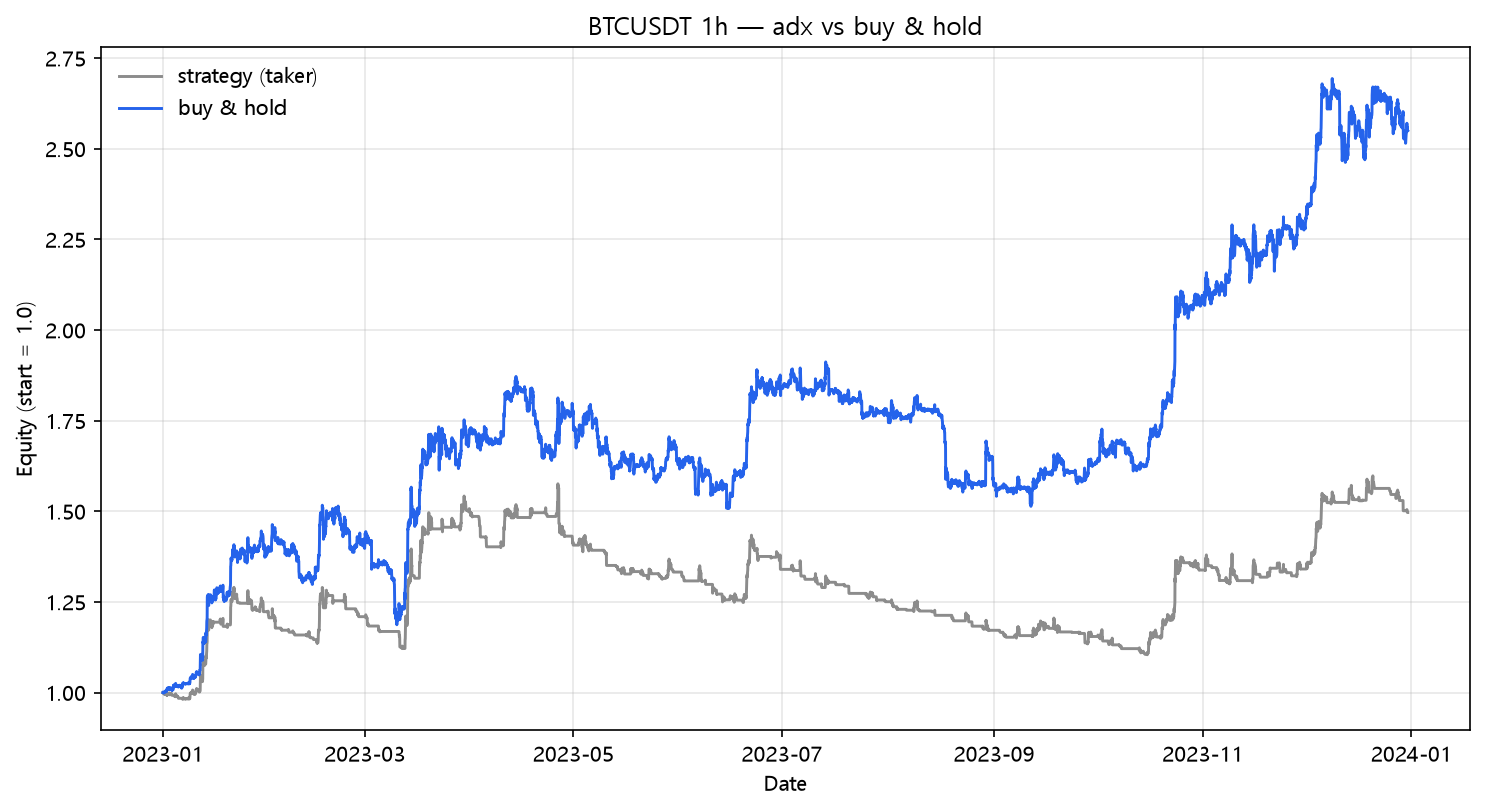
At zero cost this strategy's Sharpe (2.38 in the naive scenario below) beats buy and hold. That's the bait. Any beginner who backtests ADX without a cost model walks away believing they've found the cheat code — I did. The catch is hiding in the trade count.
The cost model reads the truth
| Scenario | Cost/leg | Total return | MaxDD | Sharpe | Trades | |---|---|---:|---:|---:|---:|---:| | naive (zero cost) | 0.00% | +92.23% | -21.22% | 2.38 | 216 | | taker fee 0.05%/leg | 0.05% | +54.88% | -29.01% | 1.64 | 216 | | + funding 0.01%/8h | 0.05% | +49.66% | -29.92% | 1.53 | 216 | | + slippage 10bp/leg | 0.15% | -2.88% | -43.46% | 0.05 | 216 | | + slippage 25bp/leg | 0.30% | -49.27% | -60.82% | -2.13 | 216 |
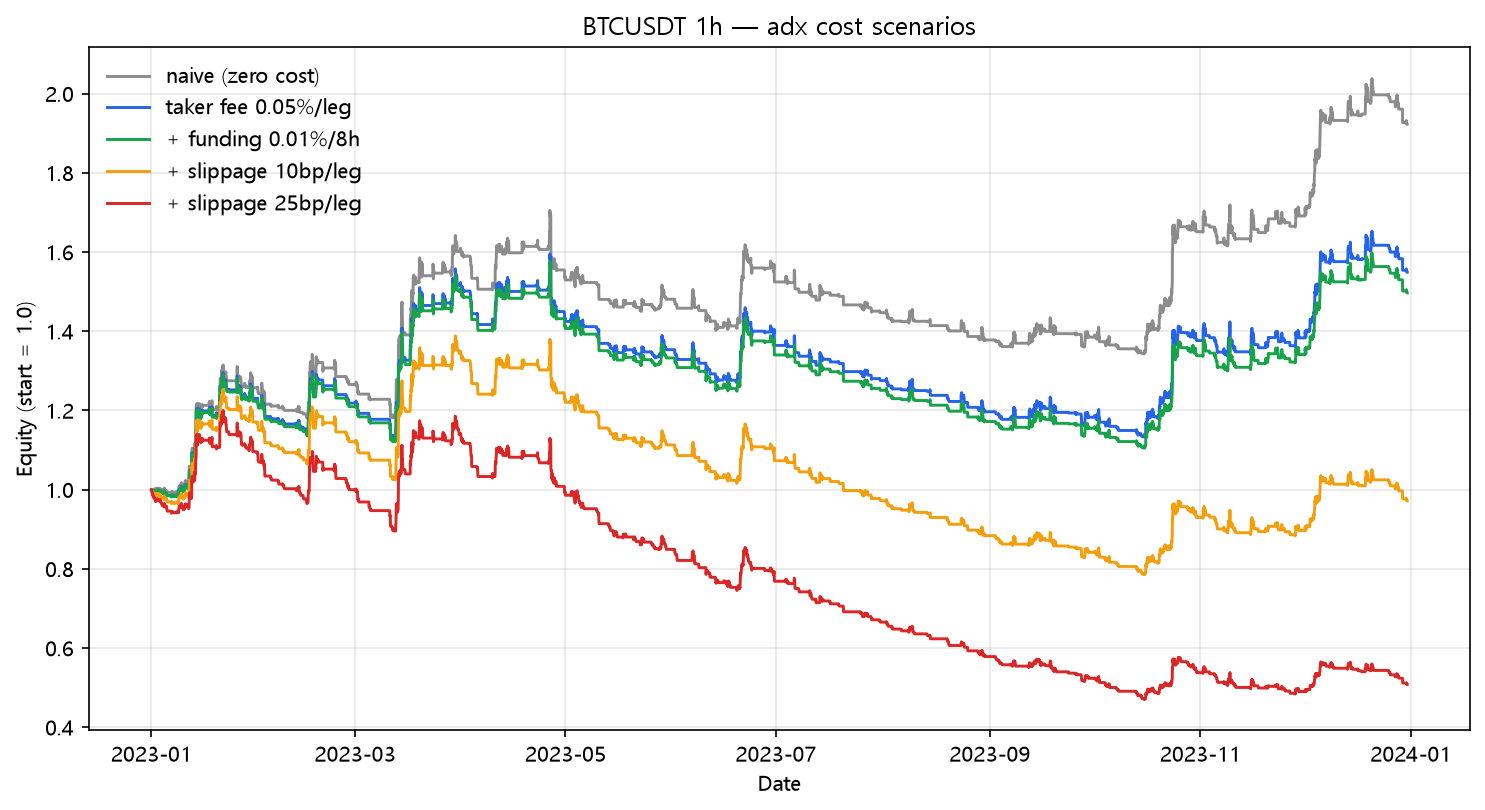
+92.23% at zero cost → -49.27% at realistic costs. The fee erased 37 points, then slippage took 52 more. ADX's two weaknesses show up here precisely because it's a smoothed indicator: it confirms trends late (so entries are late), and it flips slowly (so exits are late too). Both weaknesses multiply in a whipsaw year. As a filter on top of an already-filtered signal, it mostly adds a second helping of lag.
Buy and hold comparison
| Strategy | Total return | CAGR | MaxDD | Sharpe |
|---|---|---|---|---|
| adx | +49.66% | +49.84% | -29.92% | 1.53 |
| buy & hold | +154.94% | +155.62% | -21.74% | 2.42 |
What this does NOT prove
- One symbol, one year. On a longer or multi-market test the DMI structure may add genuine value — but the turnover finding is the robust one: a filter that doubles your trade count needs to earn back the fees first.
- ADX > 20 is one threshold. The strategy's returns are brutally sensitive to it, and the threshold's only honest setting is one you pick before looking at results — not one you tune after.
- ADX was never designed to be traded directly. This post is a stress test of a common misuse, not a claim about the indicator's proper use (as a regime check at higher timeframes).
Code
from backtest_base import fetch, backtest_signal, metrics

df = fetch("BTCUSDT", "binance", "2023-01-01", "2023-12-31", "1h")
up, down = df["high"].diff(), -df["low"].diff()
plus_dm  = np.where((up > down) & (up > 0), up, 0.0)
minus_dm = np.where((down > up) & (down > 0), down, 0.0)
atr_s    = atr(df, 14)
plus_di  = 100 * pd.Series(plus_dm, index=df.index).ewm(alpha=1/14, adjust=False).mean() / atr_s
minus_di = 100 * pd.Series(minus_dm, index=df.index).ewm(alpha=1/14, adjust=False).mean() / atr_s
adx = (100 * (plus_di - minus_di).abs() / (plus_di + minus_di)
       .ewm(alpha=1/14, adjust=False).mean())

signal = ((plus_di > minus_di) & (adx > 20)).fillna(False)
res = backtest_signal(df, signal, cost_per_leg=0.0005,
                      funding_per_bar=0.0001 / 8.0)
print(metrics(res, 8760))
Reproduce it
cd blog-drafts/scripts
python backtest_base.py --strategy adx --symbol BTCUSDT --interval 1h \
    --start 2023-01-01 --end 2023-12-31 --fee 0.0005 --funding 0.0000125
Data: Binance public API, hourly OHLCV, 8,735 bars. The tables above reproduce exactly from this command.
This is a backtest on historical data, not investment advice. Past performance does not predict future results.