Heikin-Ashi Backtest on BTC/USDT: +88.83% Gross, -43.81% Net, the Lab's Worst Churn
Heikin-Ashi trend on real hourly BTC/USDT 2023 traded 1,170 times: +88.83% naive collapses to -43.81% after fees and funding and -99.84% at 25bp. The smoothed candles made the churn problem worse, not better.
Heikin-Ashi Backtest on BTC/USDT (2023, hourly, real fees)
Heikin-Ashi candles are the trading-chart equivalent of a moving average you can look at: each HA bar is built from the previous bars' averages, so the candle body tells you the trend direction directly. The obvious rule — long when the HA close is above the HA open — is one of the most popular "trend" signals on TradingView. It is also the worst cost disaster in this entire lab. Strategy Lab #53.
The setup
Heikin-Ashi open = (previous HA open + previous HA close) / 2; HA close = (open + high + low + close) / 4. Long when HA close > HA open, flat otherwise. Same engine, same costs.
Results
| Strategy | Category | Total return | CAGR | MaxDD | Sharpe | Trades |
|---|---|---|---|---|---|---|
| heikin_ashi | trend | -43.81% | -43.81% | -56.28% | -1.68 | 1170 |
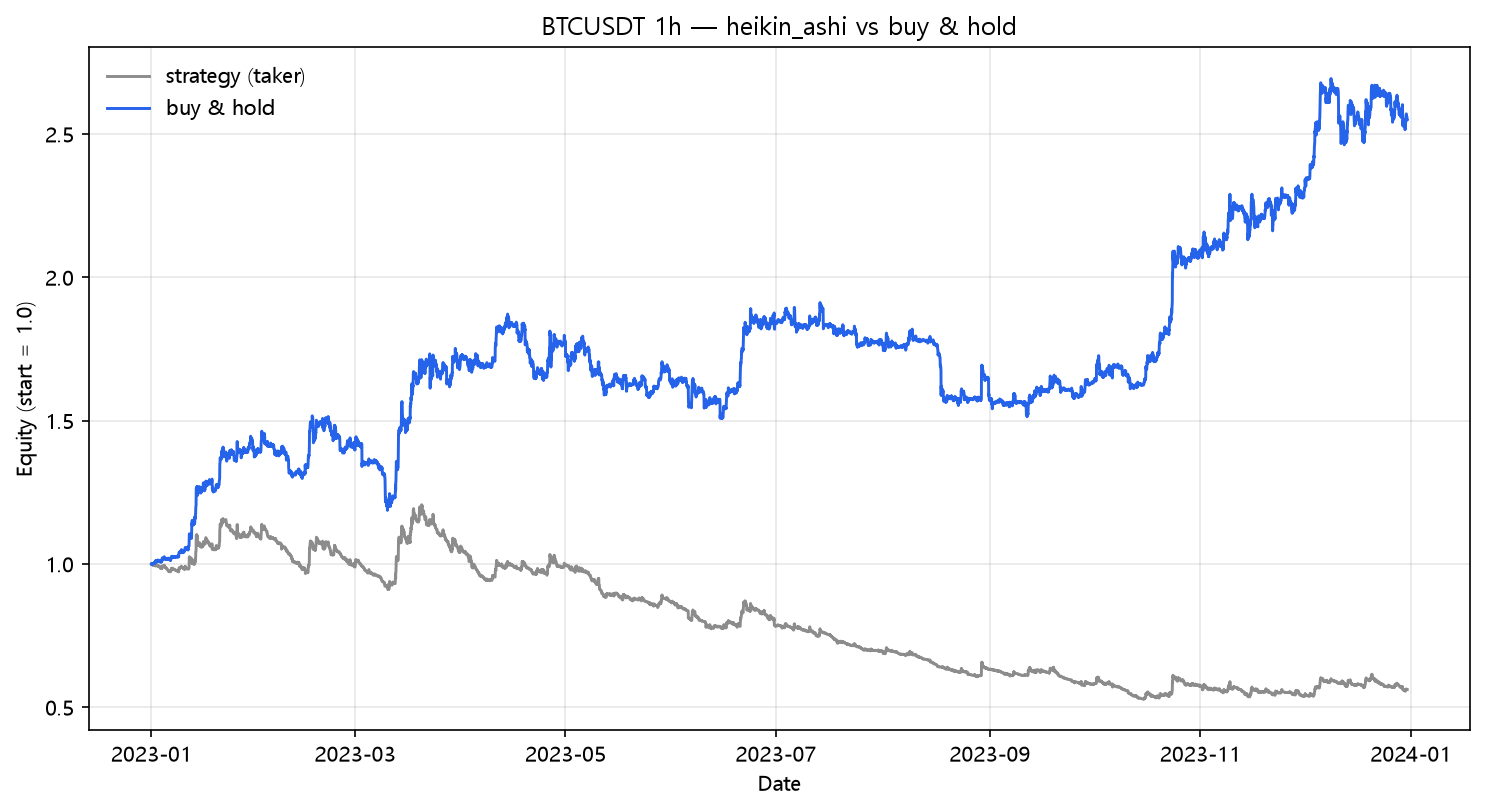
The fee bill that ended the trend family
| Scenario | Cost/leg | Total return | MaxDD | Sharpe | Trades | |---|---:|---:|---:|---:|---:|---:| | naive (zero cost) | 0.00% | +88.83% | -15.71% | 2.19 | 1170 | | taker fee 0.05%/leg | 0.05% | -41.41% | -55.27% | -1.55 | 1170 | | + funding 0.01%/8h | 0.05% | -43.81% | -56.28% | -1.68 | 1170 | | + slippage 10bp/leg | 0.15% | -94.60% | -94.73% | -8.98 | 1170 | | + slippage 25bp/leg | 0.30% | -99.84% | -99.84% | -18.90 | 1170 |
1,170 trades. No strategy in the lab has ever traded more. The HA smoothing that makes the chart pretty also makes the signal flip constantly: every time the HA body shrinks below its open, the rule exits, and on hourly bars that happens every few hours. 2,340 legs at 0.05% is 117% of the account in fees alone, before funding and before any real slippage. The naive +88.83% with a beautiful -15.7% drawdown and Sharpe 2.19 is the gross-number mirage at maximum resolution.
Why HA made it worse, not better
Heikin-Ashi's selling point is that it filters noise — the candle body stays green through intra-bar pullbacks. That filtering works visually. As a binary signal ("body green = long"), it inherited every flip plus the lag of double-averaging, so it whipsaws more than the raw close, not less. Compare the trend family's best: EMA envelope made +80.99% net on 22 trades; HA made -43.81% on 1,170. Same year, same engine, opposite outcome, one variable — trade count — separating them.
| Trend rule | Post | Trades | Naive | Fees+funding |
|---|---|---|---|---|
| EMA envelope | 24 | 22 | +96.69% | +80.99% |
| EMA crossover | 01 | 45 | +110.12% | +89.38% |
| Heikin-Ashi (this) | — | 1,170 | +88.83% | -43.81% |
What this does NOT prove
- Heikin-Ashi candles are a charting tool. Used by a human eyeballing a longer-term swing, with discretion, they can genuinely filter noise. This test only kills the naive binary rule, which is what gets copy-pasted into bots.
- A longer HA confirmation (e.g., two consecutive green bodies) would cut the churn massively and likely restore a positive net return — the lab's own frequency finding predicts it.
- One pair, one year, one regime.
Code
from backtest_base import fetch, backtest_signal, metrics
from strategy import sig_heikin_ashi

df = fetch("BTCUSDT", "binance", "2023-01-01", "2023-12-31", "1h")
signal = sig_heikin_ashi(df)

res = backtest_signal(df, signal, cost_per_leg=0.0005, funding_per_bar=0.0000125)
print(metrics(res, 8760))
Reproduce it
cd blog-drafts/scripts
python gen_post_assets.py --ids 53
Data: Binance public API, hourly OHLCV, 8,735 bars. Tables above reproduce exactly from this command.
This is a backtest on historical data, not investment advice. Past performance does not predict future results.