Rate of Change Backtest on BTC/USDT: 700 Trades, +97.20% Naive, and the -97.19% That Follows
The Rate of Change (ROC) momentum rule on real hourly BTC/USDT 2023: +97.20% naive but -6.61% with fees and funding, -97.19% at 25bp. The most churn-heavy momentum strategy in the series, and the perfect mirror of the k-NN result.
Rate of Change Backtest on BTC/USDT (2023, hourly, real fees)
I asked a friend who only trades "momentum" to describe his rule and he said, literally, "if it's up, buy it." When I pressed for a definition of "up," we landed on: price higher than it was N bars ago. That is the Rate of Change rule in its purest form — ROC = close / close.shift(12) − 1, long when positive. It's the momentum definition with the least machinery possible, and it's the only strategy in the lab whose fee collapse exactly mirrors the machine-learning one from post 18: both naive outcomes near +97%, both 25bp outcomes near -99% or -97%. Different ingredients, identical recipe: trade every bar, and the fee bill wins by 700 decisions. Strategy Lab #31.
Results
| Strategy | Category | Total return | CAGR | MaxDD | Sharpe | Trades |
|---|---|---|---|---|---|---|
| roc | momentum | -6.61% | -6.63% | -43.24% | -0.05 | 700 |
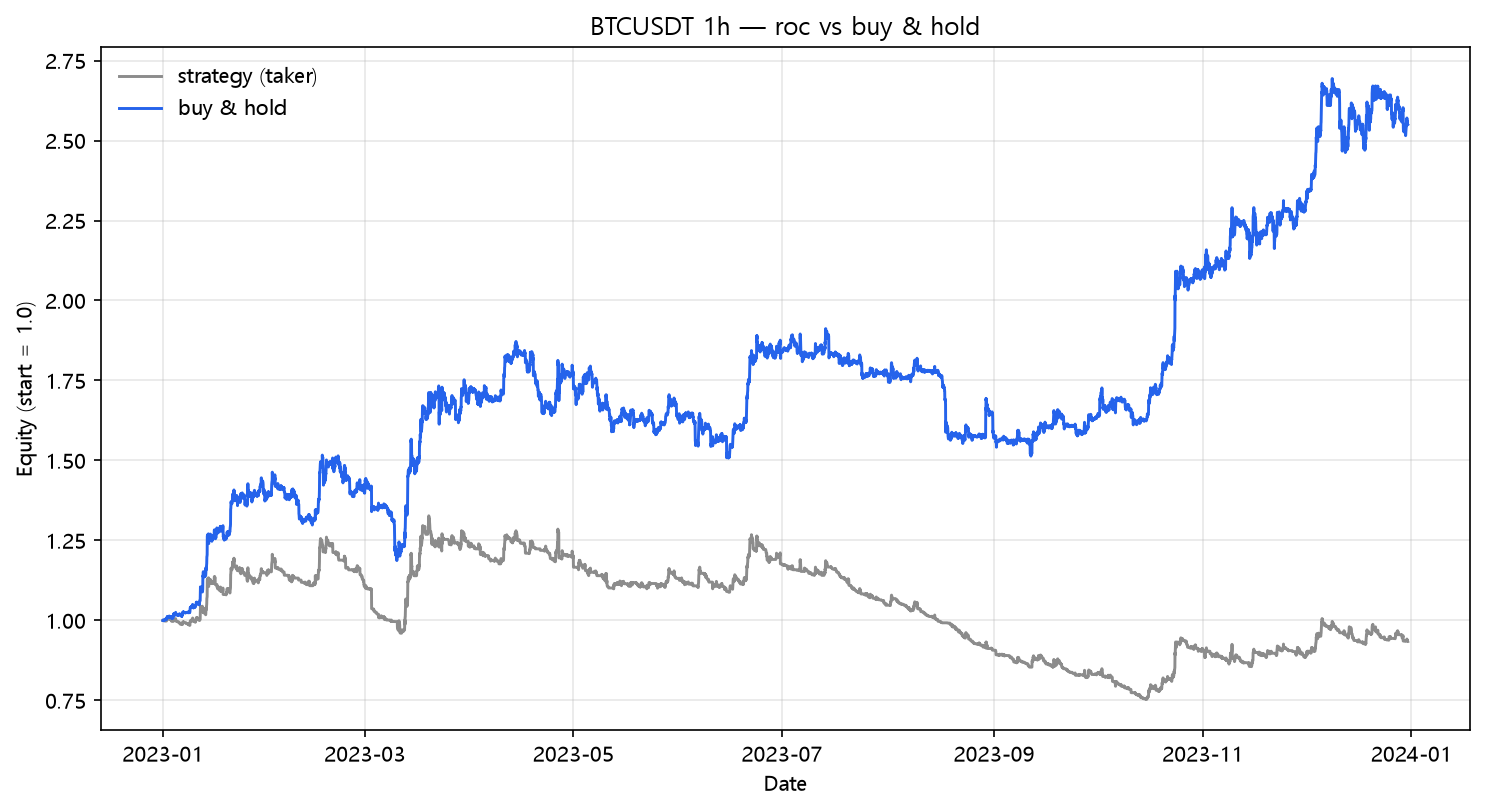
Naive ROC made +97.20% with a Sharpe of 2.26 — on paper one of the best momentum numbers of the year. The catch is 700 round trips, because "is price above where it was 12 hours ago" flips constantly on an hourly tape, and every flip is a trade. The strategy was in the market essentially all year and never once demonstrated an edge over just holding, because it isn't predicting anything — it's describing the last 12 bars.
The fee bill
| Scenario | Cost/leg | Total return | MaxDD | Sharpe | Trades | |---|---:|---:|---:|---:|---:|---:| | naive (zero cost) | 0.00% | +97.20% | -22.99% | 2.26 | 700 | | taker fee 0.05%/leg | 0.05% | -2.04% | -41.75% | 0.10 | 700 | | + funding 0.01%/8h | 0.05% | -6.61% | -43.24% | -0.05 | 700 | | + slippage 10bp/leg | 0.15% | -76.98% | -79.23% | -4.32 | 700 | | + slippage 25bp/leg | 0.30% | -97.19% | -97.19% | -10.33 | 700 |
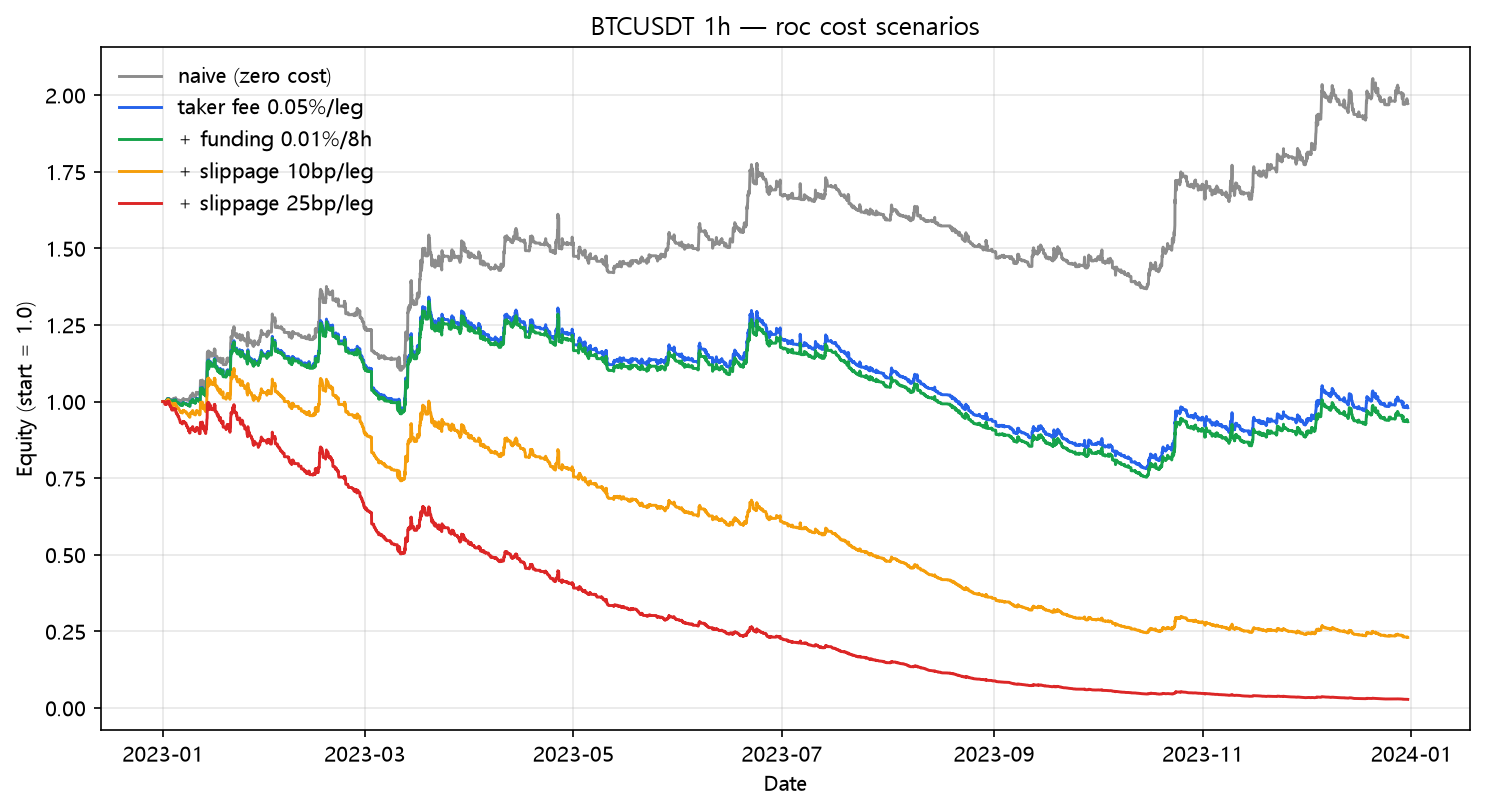
+97.20% → -97.19%. Symmetry you could frame. 1,399 legs at 25bp is 87.44% of the account per year — the cost column alone is larger than the return column. The win rate was 41.7% (292/700), indistinguishable from a coin flip, which is exactly what a 12-bar momentum sign is on hourly data: a coin flip with transaction costs. The naive table would have been a screenshot people share; the funded table is why screenshots don't pay bills.
What this does NOT prove
- ROC as a filter (long only when ROC positive, on top of a slower entry) is how momentum is actually used in the wild — this is the bare, unfiltered version.
- ROC(12) is one period; ROC(50) or ROC(100) trades far less and behaves like a slow trend follower. Same family, different animal.
- The momentum family verdict across the lab is consistent: MACD (post 15), OBV (post 16), and this — high frequency, high fee sensitivity, low real edge on hourly data.
Code
from backtest_base import fetch, backtest_signal, metrics

df = fetch("BTCUSDT", "binance", "2023-01-01", "2023-12-31", "1h")
c = df["close"]
roc = c / c.shift(12) - 1.0

signal = (roc > 0.0).fillna(False)
res = backtest_signal(df, signal, cost_per_leg=0.0005,
                      funding_per_bar=0.0001 / 8.0)
print(metrics(res, 8760))
Reproduce it
cd blog-drafts/scripts
python backtest_base.py --strategy roc --symbol BTCUSDT --interval 1h \
    --start 2023-01-01 --end 2023-12-31 --fee 0.0005 --funding 0.0000125
Data: Binance public API, hourly OHLCV, 8,735 bars. The tables above reproduce exactly from this command.
This is a backtest on historical data, not investment advice. Past performance does not predict future results.